Cell Phone Store Franchise Statistics: Census, SBA and Carrier Dealer Records
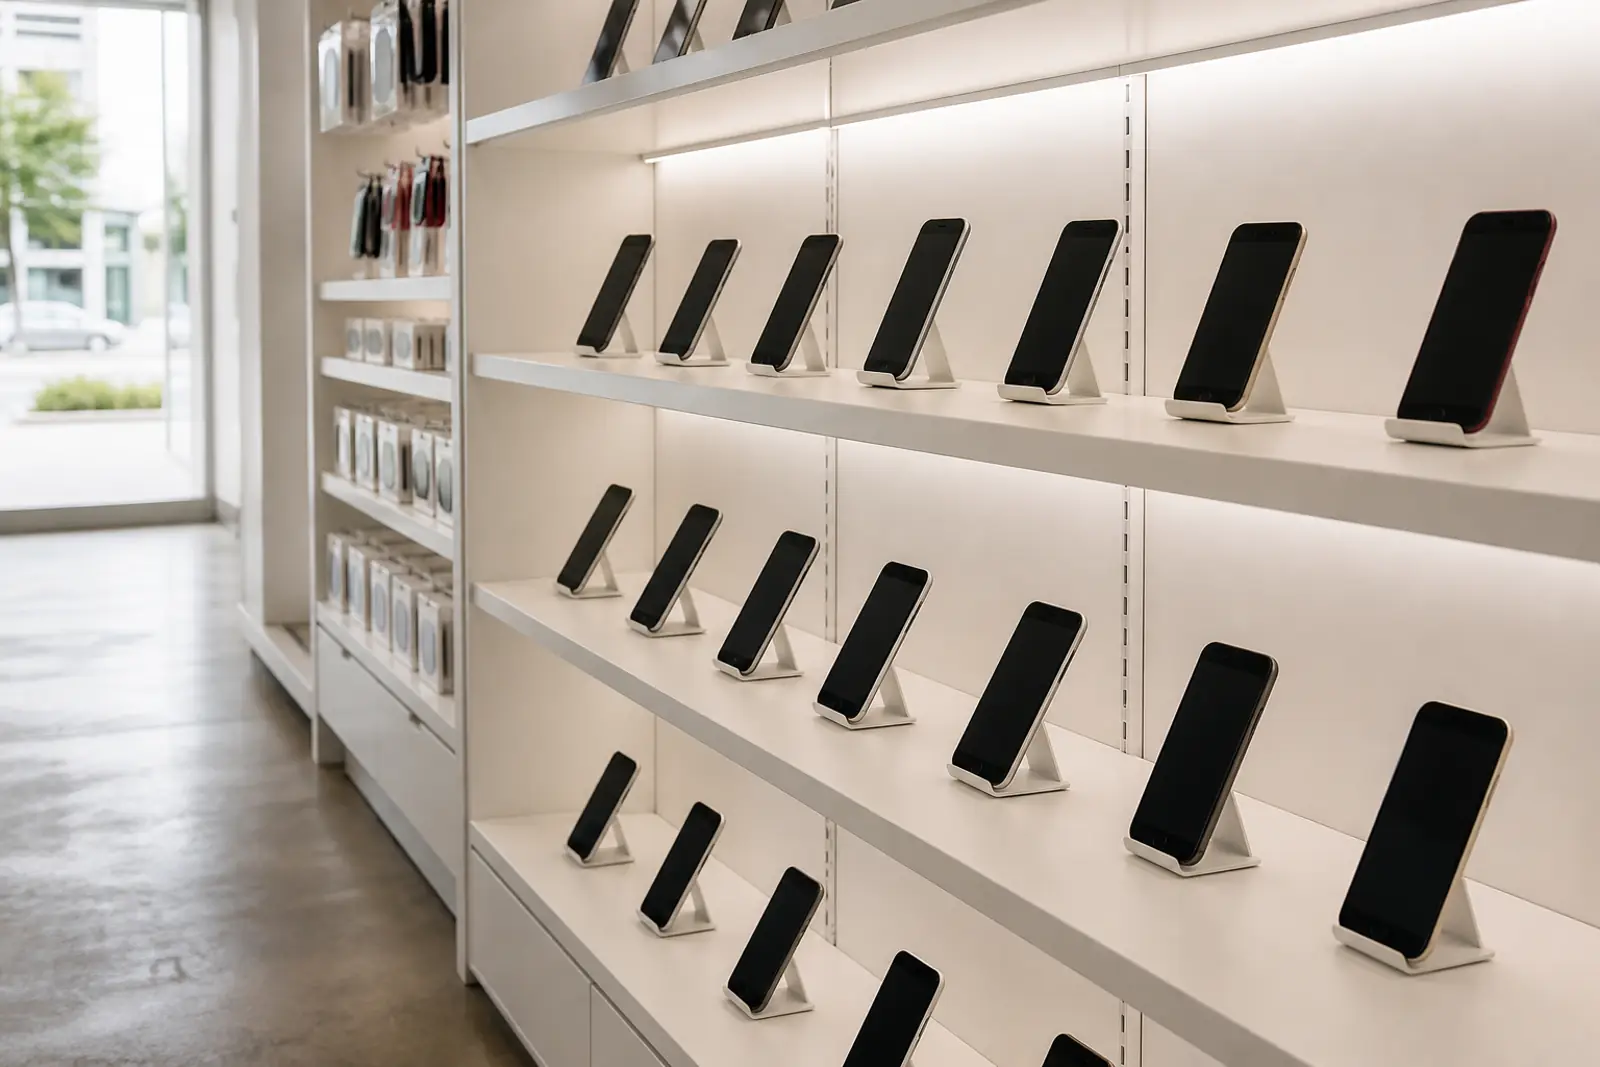
A cell phone store franchise is less common than the Census headline suggests. In 2017, 47.6% of U.S. electronics stores were franchise units, but 90.1% of those were franchisor-owned. The SBA Directory marks all 7 carrier agreements it lists as outside the FTC franchise definition, and 5.8% of SBA loans to the sector since FY2020 carried a franchise code.
Change log
- 2026-10-15: latest SBA Franchise Directory file read for this edition; the SBA updates it weekly.
- 2026-06-30: as-of date of the latest SBA 7(a) and 504 FOIA files; the next quarterly file is due about one month after the 2026-09-30 quarter end.
- 2026-02-09 to 2026-03-02: latest 10-Ks filed by AT&T (2026-02-09), T-Mobile (2026-02-11), Verizon (2026-02-17) and EchoStar (2026-03-02); none splits store counts by ownership.
- 2026-03-27 to 2026-04-17: current FDDs issued by CPR Cell Phone Repair, uBreakiFix by Asurion, Techy and PayMore.
- 2026-12-03: Census lists a 2024 Annual Business Survey release on data.census.gov.
Cell phone store franchise registry: carrier programs and franchise brands in SBA records
The registry below lists every wireless carrier, prepaid-brand, electronics retail and phone repair program that appears in the SBA Franchise Directory dated 2026-10-15 or as a franchise code on SBA 7(a) and 504 loans in the SBA FOIA files as of 2026-06-30. Each entry shows the program as the SBA coded or listed it, its Directory status, and loan counts only.
All 7 carrier and prepaid-brand agreements in the 2026-10-15 Directory (Cricket Wireless, Metro by T-Mobile, MetroPCS, Verizon Wireless, an Ameritel T-Mobile operator agreement and Open Mobile in Puerto Rico) are marked N, meaning they do not meet the FTC definition of a franchise, according to the SBA Franchise Directory. The business-format brands in the same space (Wireless Zone, Batteries Plus, PayMore, CPR Cell Phone Repair and Techy) are marked Y.
SBA loans coded to carrier or prepaid-brand programs totaled 39 from FY2010 to FY2026 Q3 (14 since FY2020), according to SBA FOIA loan data. Wireless Zone, a franchisor whose older SBA loan codes read “Verizon Wireless Zone”, carried 46 coded loans on its own. For how the Directory works across all sectors, see the site’s SBA Franchise Directory research.
| Jurisdiction | Status | What the rule requires | Date | Evidence | Source |
|---|---|---|---|---|---|
| Cricket Wireless, Authorized Retailer Agreement | Listed, does not meet FTC definition | Carrier or prepaid-brand agreement Carrier or prepaid-brand agreement. SBA loans FY2020 to FY2026 Q3: 2; FY2010 to FY2026 Q3: 7. FOIA codes (loans): 16511 (5), S4411 (2). Most common loan NAICS: 443142, 423690, 517911. Date shown: Directory listing start date. Directory rows: 2. | 2019-07-23 | Primary (SBA Franchise Directory) | Source |
| Cricket Wireless, Exclusive Dealer Agreement | Listed, does not meet FTC definition | Carrier or prepaid-brand agreement Carrier or prepaid-brand agreement. SBA loans FY2020 to FY2026 Q3: 0; FY2010 to FY2026 Q3: 0. FOIA codes (loans): no FOIA code on any loan. Most common loan NAICS: n/a. Date shown: Directory listing start date. | 2018-02-28 | Primary (SBA Franchise Directory) | Source |
| Metro by T-Mobile, Exclusive Indirect Dealer Agreement | Listed, does not meet FTC definition | Carrier or prepaid-brand agreement Carrier or prepaid-brand agreement. SBA loans FY2020 to FY2026 Q3: 0; FY2010 to FY2026 Q3: 0. FOIA codes (loans): no FOIA code on any loan. Most common loan NAICS: n/a. Date shown: Directory listing start date. | 2021-11-29 | Primary (SBA Franchise Directory) | Source |
| MetroPCS, Exclusive Subdealer Agreement | Listed, does not meet FTC definition | Carrier or prepaid-brand agreement Carrier or prepaid-brand agreement. SBA loans FY2020 to FY2026 Q3: 0; FY2010 to FY2026 Q3: 0. FOIA codes (loans): no FOIA code on any loan. Most common loan NAICS: n/a. Date shown: Directory listing start date. | 2020-08-17 | Primary (SBA Franchise Directory) | Source |
| MetroPCS (Texas), Exclusive Dealer Agreement | Not in 2026-10-15 Directory | Carrier or prepaid-brand agreement Carrier or prepaid-brand agreement. SBA loans FY2020 to FY2026 Q3: 3; FY2010 to FY2026 Q3: 12. FOIA codes (loans): S2041 (12). Most common loan NAICS: 443142, 517312, 517911. Date shown: latest coded loan approval. | 2020-03-06 | Primary (SBA FOIA loan code) | Source |
| Metro PCS, Master Dealer Agreement | Not in 2026-10-15 Directory | Carrier or prepaid-brand agreement Carrier or prepaid-brand agreement. SBA loans FY2020 to FY2026 Q3: 2; FY2010 to FY2026 Q3: 2. FOIA codes (loans): S4279 (2). Most common loan NAICS: 517312, 517112. Date shown: latest coded loan approval. | 2023-04-19 | Primary (SBA FOIA loan code) | Source |
| Metro PCS, Sublicense Agreement | Not in 2026-10-15 Directory | Carrier or prepaid-brand agreement Carrier or prepaid-brand agreement. SBA loans FY2020 to FY2026 Q3: 2; FY2010 to FY2026 Q3: 3. FOIA codes (loans): S4280 (3). Most common loan NAICS: 445120, 453998, 443142. Date shown: latest coded loan approval. | 2021-09-22 | Primary (SBA FOIA loan code) | Source |
| Ameritel Management (T-Mobile), Operator Agreement | Listed, does not meet FTC definition | Carrier or prepaid-brand agreement Carrier or prepaid-brand agreement. SBA loans FY2020 to FY2026 Q3: 0; FY2010 to FY2026 Q3: 0. FOIA codes (loans): no FOIA code on any loan. Most common loan NAICS: n/a. Date shown: Directory listing start date. | 2020-07-29 | Primary (SBA Franchise Directory) | Source |
| T-Mobile (legacy numeric codes) | Not in 2026-10-15 Directory | Carrier or prepaid-brand agreement Carrier or prepaid-brand agreement. SBA loans FY2020 to FY2026 Q3: 0; FY2010 to FY2026 Q3: 3. FOIA codes (loans): 13955 (2), 79924 (1). Most common loan NAICS: 443112, 517210, 443142. Date shown: latest coded loan approval. | 2017-09-21 | Primary (SBA FOIA loan code) | Source |
| Sprint PrePaid Group, Branded Retailer Program | Not in 2026-10-15 Directory | Carrier or prepaid-brand agreement Carrier or prepaid-brand agreement. SBA loans FY2020 to FY2026 Q3: 5; FY2010 to FY2026 Q3: 9. FOIA codes (loans): S4104 (9). Most common loan NAICS: 517312, 443142, 517112. Date shown: latest coded loan approval. | 2022-06-27 | Primary (SBA FOIA loan code) | Source |
| Sprint Store Express (legacy code) | Not in 2026-10-15 Directory | Carrier or prepaid-brand agreement Carrier or prepaid-brand agreement. SBA loans FY2020 to FY2026 Q3: 0; FY2010 to FY2026 Q3: 1. FOIA codes (loans): 13606 (1). Most common loan NAICS: 443142. Date shown: latest coded loan approval. | 2017-05-06 | Primary (SBA FOIA loan code) | Source |
| Verizon Wireless, Exclusive Agent Agreement | Listed, does not meet FTC definition | Carrier or prepaid-brand agreement Carrier or prepaid-brand agreement. SBA loans FY2020 to FY2026 Q3: 0; FY2010 to FY2026 Q3: 0. FOIA codes (loans): no FOIA code on any loan. Most common loan NAICS: n/a. Date shown: Directory listing start date. | 2017-10-01 | Primary (SBA Franchise Directory) | Source |
| AT&T Wireless (legacy numeric codes) | Not in 2026-10-15 Directory | Carrier or prepaid-brand agreement Carrier or prepaid-brand agreement. SBA loans FY2020 to FY2026 Q3: 0; FY2010 to FY2026 Q3: 2. FOIA codes (loans): 06170 (1), 10297 (1). Most common loan NAICS: 517919, 453998. Date shown: latest coded loan approval. | 2017-01-19 | Primary (SBA FOIA loan code) | Source |
| Open Mobile, Exclusive Authorized Agent Agreement (Puerto Rico) | Listed, does not meet FTC definition | Carrier or prepaid-brand agreement Carrier or prepaid-brand agreement. SBA loans FY2020 to FY2026 Q3: 0; FY2010 to FY2026 Q3: 0. FOIA codes (loans): no FOIA code on any loan. Most common loan NAICS: n/a. Date shown: Directory listing start date. | 2018-05-29 | Primary (SBA Franchise Directory) | Source |
| Wireless Zone | Listed, meets FTC definition | Franchise selling carrier service Franchise selling carrier service. SBA loans FY2020 to FY2026 Q3: 6; FY2010 to FY2026 Q3: 46. FOIA codes (loans): 14325 (30), 85357 (6), 89787 (1), S1941 (9). Most common loan NAICS: 443142, 443112, 453998. Date shown: Directory listing start date. | 2017-10-01 | Primary (SBA Franchise Directory) | Source |
| Batteries Plus | Listed, meets FTC definition | Electronics retail franchise Electronics retail franchise. SBA loans FY2020 to FY2026 Q3: 74; FY2010 to FY2026 Q3: 167. FOIA codes (loans): 09118 (20), 10405 (54), S0196 (93). Most common loan NAICS: 453998, 443142, 441310. Date shown: Directory listing start date. | 2017-10-01 | Primary (SBA Franchise Directory) | Source |
| PayMore Stores | Listed, meets FTC definition | Electronics retail franchise Electronics retail franchise. SBA loans FY2020 to FY2026 Q3: 18; FY2010 to FY2026 Q3: 18. FOIA codes (loans): S6898 (18). Most common loan NAICS: 449210, 423430, 453310. Date shown: Directory listing start date. | 2021-10-07 | Primary (SBA Franchise Directory) | Source |
| Experimac / Experimax | Not in 2026-10-15 Directory | Electronics retail franchise Electronics retail franchise. SBA loans FY2020 to FY2026 Q3: 2; FY2010 to FY2026 Q3: 82. FOIA codes (loans): 15975 (66), S0590 (16). Most common loan NAICS: 811212, 443142, 811211. Date shown: latest coded loan approval. | 2021-11-04 | Primary (SBA FOIA loan code) | Source |
| Cellairis | Not in 2026-10-15 Directory | Electronics retail franchise Electronics retail franchise. SBA loans FY2020 to FY2026 Q3: 0; FY2010 to FY2026 Q3: 12. FOIA codes (loans): 10756 (6), S0353 (6). Most common loan NAICS: 443142, 454390, 423990. Date shown: latest coded loan approval. | 2019-09-06 | Primary (SBA FOIA loan code) | Source |
| Device Pitstop | Not in 2026-10-15 Directory | Electronics retail franchise Electronics retail franchise. SBA loans FY2020 to FY2026 Q3: 2; FY2010 to FY2026 Q3: 6. FOIA codes (loans): 15455 (2), S0503 (4). Most common loan NAICS: 443142, 449210, 811211. Date shown: latest coded loan approval. | 2023-05-11 | Primary (SBA FOIA loan code) | Source |
| ZAGG | Not in 2026-10-15 Directory | Electronics retail franchise Electronics retail franchise. SBA loans FY2020 to FY2026 Q3: 1; FY2010 to FY2026 Q3: 1. FOIA codes (loans): S5210 (1). Most common loan NAICS: 449210. Date shown: latest coded loan approval. | 2025-01-02 | Primary (SBA FOIA loan code) | Source |
| RadioShack (legacy codes) | Not in 2026-10-15 Directory | Electronics retail franchise Electronics retail franchise. SBA loans FY2020 to FY2026 Q3: 0; FY2010 to FY2026 Q3: 15. FOIA codes (loans): 13078 (2), 68150 (13). Most common loan NAICS: 443112, 443142, 443120. Date shown: latest coded loan approval. | 2015-04-27 | Primary (SBA FOIA loan code) | Source |
| uBreakiFix | Not in 2026-10-15 Directory | Phone and device repair franchise Phone and device repair franchise. SBA loans FY2020 to FY2026 Q3: 18; FY2010 to FY2026 Q3: 64. FOIA codes (loans): 15105 (28), S2496 (36). Most common loan NAICS: 811211, 811212, 811219. Date shown: latest coded loan approval. | 2026-05-28 | Primary (SBA FOIA loan code) | Source |
| CPR Cell Phone Repair | Listed, meets FTC definition | Phone and device repair franchise Phone and device repair franchise. SBA loans FY2020 to FY2026 Q3: 6; FY2010 to FY2026 Q3: 32. FOIA codes (loans): 10990 (21), S2369 (11). Most common loan NAICS: 811211, 811213, 443142. Date shown: Directory listing start date. | 2018-01-01 | Primary (SBA Franchise Directory) | Source |
| Techy (formerly DrPhoneFix) | Listed, meets FTC definition | Phone and device repair franchise Phone and device repair franchise. SBA loans FY2020 to FY2026 Q3: 3; FY2010 to FY2026 Q3: 3. FOIA codes (loans): S5428 (3). Most common loan NAICS: 811219, 811211, 811210. Date shown: Directory listing start date. | 2020-05-10 | Primary (SBA Franchise Directory) | Source |
| Cell Phone Repair (code S0352) | Not in 2026-10-15 Directory | Phone and device repair franchise Phone and device repair franchise. SBA loans FY2020 to FY2026 Q3: 3; FY2010 to FY2026 Q3: 3. FOIA codes (loans): S0352 (3). Most common loan NAICS: 443142, 811210. Date shown: latest coded loan approval. | 2023-04-05 | Primary (SBA FOIA loan code) | Source |
| Other phone repair codes (iDropped, Lifeline Smartphone & Tablet Repair, Fix My Phones Plus, Genius Phone Repair, Mobile Bling) | Not in 2026-10-15 Directory | Phone and device repair franchise Phone and device repair franchise. SBA loans FY2020 to FY2026 Q3: 2; FY2010 to FY2026 Q3: 6. FOIA codes (loans): 16050 (2), S2013 (1), S2036 (1), S3347 (1), S6238 (1). Most common loan NAICS: 811212, 811211, 811213. Date shown: latest coded loan approval. | 2022-01-21 | Primary (SBA FOIA loan code) | Source |
What NAICS 443142 covers, and where phone stores are classified
Most phone stores that sell carrier plans are not in the electronics-store code at all. The 2017 NAICS index places “Cellular telephone stores, primarily selling cellular phone service plans” and “Wireless phone stores, primarily selling wireless phone service plans” in 517312, Wireless Telecommunications Carriers, according to the Census 2017 NAICS index.
NAICS 443142, Electronics Stores, holds 18 index entries in 2017, including cellular telephone accessories stores, computer stores and consumer electronics stores (Census 2017 NAICS index). In NAICS 2012 and 2017 the code also absorbed three NAICS 2007 codes: 443112, 443120, 443130 (Census 2012-to-2007 concordance).
NAICS 2022 made the dealer model explicit. Code 517122 covers establishments acting as agents for wireless telecommunications carriers and resellers, selling wireless plans on a commission basis (Census 2022 NAICS descriptions), and its index entries include cellular and wireless phone stores selling plans on an agent basis (Census 2022 NAICS index). Electronics stores merged with appliance stores into 449210, built from all or part of 2017 codes 443141, 443142, 454110, 454390 (Census 2022-to-2017 concordance).
The Economic Census franchise file does not tabulate any wireless carrier or reseller code: its only sector 51 row is 511120 (periodical publishers only), according to the 2017 Economic Census franchise file. Franchise status for carrier-plan stores classified in 517312 is therefore not published.
Census franchised share of electronics stores, 2007 to 2017
Electronics stores (NAICS 443142) were among the most franchised retail industries in the 2017 Economic Census, but the result rests on a sharp one-census jump with thin response coverage. The 2017 file is the latest U.S. franchise tabulation: the 2022 release list shows a franchise table for Puerto Rico only (Census 2022 release list).
- In 2017, 10,992 of 23,078 U.S. electronics-store establishments (47.6%) were franchise units, according to the 2017 Economic Census.
- That share ranked No. 2 of 58 retail industries with at least 1,000 establishments in 2017, behind new car dealers (100.0%), and No. 7 of 241 industries of that size in all sectors (calculation from the 2017 Economic Census).
- In 2012 the share was 8.2% (3,336 of 40,521 establishments), ranking No. 18 of 62 retail industries (2012 Economic Census).
- In 2007 the three predecessor codes combined had a franchise share of 6.2% (2,576 of 41,467), according to the 2007 Economic Census.
- Franchise establishments rose 229.5% from 2012 to 2017 while all electronics-store establishments in the Census count fell 43.0% (calculation from the 2017 and 2012 files).
Two warnings apply. First, Census gives the 2017 franchise inquiry for this industry a coverage range code of 1, which the 2017 data dictionary defines as 10% to less than 20% of sales, against 46.0% in 2012. Second, the BLS QCEW counted 40,275 private electronics-store establishments in 2017, 17,197 more than the Economic Census, so the two frames disagree on the size of the industry in the same year.
| Census year | All establishments | Franchise establishments | Franchise share of establishments (%) | Franchisee-owned | Franchisor-owned | Franchisor-owned share of franchise units (%) | Franchise share of sales (%) | Franchise-inquiry coverage (% of sales) |
|---|---|---|---|---|---|---|---|---|
| 2007 | 41,467 | 2,576 | 6.2 | 2,164 | 412 | 16 | 1.6 | 87.9 / 72.5 / 88.4 |
| 2012 | 40,521 | 3,336 | 8.2 | 2,767 | 569 | 17.1 | 3.5 | 46.0 |
| 2017 | 23,078 | 10,992 | 47.6 | 1,084 | 9,908 | 90.1 | 43.7 | 10 to <20 (range code 1) |
Owner type and store size: franchisee-owned, franchisor-owned and independent
The 2017 franchise count is mostly stores owned by the brand company itself, not by franchisees. Of 10,992 franchise electronics stores in 2017, 9,908 (90.1%) were franchisor-owned and 1,084 were franchisee-owned, according to the 2017 Economic Census. Franchisee-owned stores were 4.7% of all electronics stores.
- The 90.1% franchisor-owned share ranked No. 1 of 33 retail industries with at least 500 franchise establishments in 2017 (calculation from the 2017 Economic Census).
- In 2012 the split ran the other way: 2,767 franchisee-owned and 569 franchisor-owned (17.1% franchisor-owned), per the 2012 Economic Census.
- A franchisee-owned electronics store averaged $1,381,930 in 2017 sales and 8.7 paid employees, against $3,473,053 and 12.0 for a non-franchise store, a sales ratio of 0.40 (calculation from the 2017 Economic Census).
- Franchisor-owned stores averaged $3,135,441 in sales and 11.7 employees in 2017.
- The franchisee-owned to non-franchise sales ratio was 0.44 in 2012 and 0.18 in 2007.
The non-franchise group includes large chain stores and every store that did not answer the franchise question, so the comparison describes the groups as Census counts them, not the earning power of any format. The file does not identify the companies behind the franchisor-owned count.
| Census year | Group | Establishments | Sales per establishment ($) | Paid employees per establishment |
|---|---|---|---|---|
| 2017 | Franchisee-owned | 1,084 | 1,381,930 | 8.7 |
| 2017 | Franchisor-owned | 9,908 | 3,135,441 | 11.7 |
| 2017 | All franchise | 10,992 | 2,962,515 | 11.4 |
| 2017 | Non-franchise | 12,086 | 3,473,053 | 12 |
| 2012 | Franchisee-owned | 2,767 | 984,823 | 7 |
| 2012 | Franchisor-owned | 569 | 551,387 | 4.6 |
| 2012 | All franchise | 3,336 | 910,894 | 6.6 |
| 2012 | Non-franchise | 37,185 | 2,242,574 | 9.3 |
| 2007 | Franchisee-owned | 2,164 | 419,172 | 3.8 |
| 2007 | Franchisor-owned | 412 | 1,398,733 | 5.2 |
| 2007 | All franchise | 2,576 | 575,841 | 4 |
| 2007 | Non-franchise | 38,891 | 2,314,941 | 10.4 |
Firm-level view: few electronics retail firms operate as franchises
Counted by firm instead of by store, electronics retail is one of the less franchised parts of retail. The Annual Business Survey asks employer firms whether all or part of the business operated as a franchise.
- 1.6% of reporting electronics and appliance retail firms (NAICS 2022 4492) operated as a franchise in reference year 2023 (2024 ABS), standard error 0.5 points, against 8.5% of all retail firms and 4.7% of firms in all sectors (2024 ABS).
- Under the NAICS 2017 code (4431), the share was 7.3% in 2021 (2022 ABS, standard error 1.8), 5.3% in 2020 and 6.8% in 2019 (2022 ABS, 2021 ABS, 2020 ABS).
- The wired and wireless telecommunications group (NAICS 2022 5171, which includes resellers and agents for wireless carriers) reported 7.0% in 2023 and 10.3% in 2022 (2024 ABS, 2023 ABS).
Firm and store counts answer different questions. One company with thousands of stores is one ABS firm, so a high Census store share and a low ABS firm share can both be correct. The ABS does not split out agents for wireless carriers, and its labels follow the collection year: “The 2024 ABS covers reference year 2023” (ABS methodology).
| Reference year (survey) | Electronics NAICS row | Electronics and appliance franchise share (%) | Standard error (pts) | Franchise firms (electronics) | All retail franchise share (%) | All sectors franchise share (%) | Telecommunications franchise share (%) | Telecom NAICS row |
|---|---|---|---|---|---|---|---|---|
| 2019 (2020 ABS) | 443 | 6.8 | 1.4 | 449 | 8.4 | 4.9 | withheld | 517 |
| 2020 (2021 ABS) | 4431 | 5.3 | 1.5 | 302 | 8 | 4.8 | 5.1 | 517 |
| 2021 (2022 ABS) | 4431 | 7.3 | 1.8 | 627 | 8.4 | 4.7 | 7.9 | 517 |
| 2022 (2023 ABS) | 4492 | 3.6 | 0.4 | 309 | 8.1 | 4.6 | 10.3 | 5171 |
| 2023 (2024 ABS) | 4492 | 1.6 | 0.5 | 120 | 8.5 | 4.7 | 7 | 5171 |
SBA lending to cell phone and electronics stores, FY2010 to FY2026
SBA borrowers in phone and electronics retail use franchise codes less often than SBA borrowers in general. From FY2010 to FY2026 Q3, lenders approved 3,018 SBA 7(a) and 504 loans to businesses coded to electronics retail or wireless-service NAICS codes, and 192 (6.4%) carried a franchise code, according to SBA FOIA loan data. Across all SBA loans the coded share was 10.0%.
- Since FY2020 the sector share is 5.8% (60 of 1,026 loans), against 11.7% for all SBA loans (SBA FOIA loan data).
- Electronics retail NAICS alone: 158 coded of 2,213 loans (7.1%); wireless-service NAICS alone: 34 of 805 (4.2%).
- Carrier-program codes made up 16.1% of franchise-coded loans in these NAICS codes (31 loans); across all NAICS codes, 39 loans worth $24,275,200 carried a carrier-program code.
- Franchise-coded loans in the sector were more often startups: 34.4% against 5.5% of uncoded loans, with a median of $177,500 against $130,000.
The coding gap is visible in the totals. Across all SBA loans, the franchise-coded share was 13.6% for loans approved from October 2019 to 2023-05-10, 8.6% while the Directory was not published, and 13.2% after it returned on 2025-06-01 (SBA FOIA loan data). Treat FY2023 to FY2025 franchise counts as undercounts. Annual counts in this sector are small (FY2026 Q3: 99 loans), so single-year shares move a lot.
| Fiscal year | Loans (electronics retail + wireless NAICS) | Franchise-coded loans | Franchise-coded share (%) | All SBA loans: franchise-coded share (%) | Carrier-program loans (any NAICS) |
|---|---|---|---|---|---|
| FY2010 | 263 | 15 | 5.7 | 6 | 0 |
| FY2011 | 252 | 17 | 6.7 | 5.7 | 2 |
| FY2012 | 222 | 6 | 2.7 | 6.6 | 0 |
| FY2013 | 144 | 10 | 6.9 | 7.4 | 0 |
| FY2014 | 193 | 12 | 6.2 | 9.3 | 1 |
| FY2015 | 226 | 14 | 6.2 | 9.5 | 0 |
| FY2016 | 198 | 17 | 8.6 | 9.4 | 2 |
| FY2017 | 194 | 18 | 9.3 | 9.5 | 6 |
| FY2018 | 170 | 10 | 5.9 | 11.5 | 6 |
| FY2019 | 130 | 13 | 10 | 12.9 | 8 |
| FY2020 | 101 | 6 | 5.9 | 13 | 5 |
| FY2021 | 103 | 13 | 12.6 | 14.6 | 5 |
| FY2022 | 119 | 9 | 7.6 | 13.3 | 1 |
| FY2023 | 193 | 8 | 4.1 | 12.6 | 1 |
| FY2024 | 208 | 11 | 5.3 | 8.3 | 0 |
| FY2025 | 203 | 11 | 5.4 | 9.1 | 2 |
| FY2026 | 99 | 2 | 2 | 13.4 | 0 |
Authorized dealer vs business-format franchise under the FTC Rule
Whether a phone store agreement is a franchise depends on its terms, not its name. The FTC Franchise Rule covers an arrangement that has all three elements: trademark association; significant control or assistance; required payment to the franchisor or affiliate (16 CFR 436.1(h)).
- Buying inventory is not a franchise payment: the rule excludes payments for reasonable amounts of inventory at bona fide wholesale prices for resale (16 CFR 436.1(s)). Dealers that buy phones and accessories for resale may fall under that exclusion; whether they do depends on the payment terms.
- The rule does not apply if required payments in the first six months total less than $735 (16 CFR 436.8(a)(1), threshold amended 2024-07-12).
- The FTC’s compliance guide says the name of an arrangement is irrelevant to coverage, and that a supplier can avoid coverage by prohibiting the distributor from using its mark (FTC Franchise Rule Compliance Guide).
- The SBA lists brands that meet the FTC definition (which must be in the Directory to get SBA financing) and, on request, brands that do not (SBA Directory page). Of 3,498 listings on 2026-10-15, 1,009 (28.8%) were marked N (SBA Franchise Directory).
The carrier side of the market fits the dealer pattern in its own words. A Cricket dealer described itself as operating “as an authorized Cricket dealer, selling cellular phones and accessories, providing ancillary services and accepting service payments from customers” (Western Capital Resources 10-K, FY2017). The same model now has its own NAICS code, 517122, defined by commission-based plan sales (NAICS 2022). For the automotive version of this dealer question, see the site’s automotive franchise statistics.
Carrier store ownership mix in 10-K filings
The national carriers describe their sales channels but do not publish store counts split between company stores and dealers. Of the 4 FY2025 10-K filings reviewed (AT&T, T-Mobile, Verizon, EchoStar), 0 state such a split.
- AT&T sells through company-owned stores, agents and third-party retail stores (AT&T 10-K, FY2025).
- Verizon describes company-operated stores (direct); agents at retail locations, mostly under exclusive selling arrangements (indirect) (Verizon 10-K, FY2025).
- T-Mobile reports owned and operated T-Mobile and Metro by T-Mobile stores; devices sold to dealers and third-party distributors (T-Mobile 10-K, FY2025); its FY2018 filing listed about 2,200 leased T-Mobile and Metro by T-Mobile retail locations (T-Mobile 10-K, FY2018).
- EchoStar (Boost Mobile) describes an indirect channel of third-party owned retail stores and big box stores; direct online channel (EchoStar 10-K, FY2025).
Counts appear on the dealer side instead. Spring Mobile, an AT&T authorized retailer owned by GameStop, operated 1,329 AT&T branded stores on 2018-02-03, down from 1,403 a year earlier (GameStop 10-K, fiscal 2017); GameStop sold that business, over 1,200 stores, in January 2019 (GameStop 10-K, fiscal 2018). Western Capital Resources operated 278 Cricket stores at the end of 2017 and 229 at the end of 2021, a 17.6% decline (FY2017 and FY2021 10-Ks). Both are dealer-side disclosures, not carrier totals.
| Company | Filing | Channels or stores described | Store count split by ownership? | Counts stated |
|---|---|---|---|---|
| AT&T (Cricket, AT&T PREPAID) | 10-K FY2025 | company-owned stores, agents and third-party retail stores | No | none |
| T-Mobile (T-Mobile, Metro by T-Mobile, Mint) | 10-K FY2025 | owned and operated T-Mobile and Metro by T-Mobile stores; devices sold to dealers and third-party distributors | No | none |
| Verizon | 10-K FY2025 | company-operated stores (direct); agents at retail locations, mostly under exclusive selling arrangements (indirect) | No | none |
| EchoStar (Boost Mobile) | 10-K FY2025 | indirect channel of third-party owned retail stores and big box stores; direct online channel | No | none |
| T-Mobile | 10-K FY2018 | leased retail locations listed under properties | No (total only) | approximately 2,200 T-Mobile and Metro by T-Mobile retail locations, 2018-12-31 |
| GameStop (Spring Mobile, an AT&T authorized retailer) | 10-K FY2017 and FY2018 | dealer-side filing: AT&T branded stores it operated | Dealer side | 1,329 stores (2018-02-03); over 1,200 sold January 2019 |
| Western Capital Resources (Cricket authorized retailer) | 10-K FY2017 and FY2021 | dealer-side filing: Cricket stores it operated | Dealer side | 278 stores (2017-12-31); 229 stores (2021-12-31) |
FDDs for phone, repair and electronics franchises
Franchise Disclosure Documents exist for the business-format brands, not for carrier programs. The site’s Minnesota FDD sample holds three phone and device repair systems and no wireless retail franchisor; a fourth current FDD (PayMore) came from the California DFPI.
- Item 7 estimated initial investment ranges from $90,350 (low end, CPR Cell Phone Repair) to $468,150 (high end, uBreakiFix by Asurion) across the four 2026 FDDs.
- Initial franchise fees run from $15,000 (Techy) to $40,000 (uBreakiFix, plus a $12,500 training fee), according to each FDD’s Item 5.
- uBreakiFix by Asurion reported 549 franchised and 128 company or affiliate outlets at the end of 2025; CPR reported 418 franchised outlets; Techy 151; PayMore 99 (Item 20, Table 1 of each FDD).
- Wireless Zone, listed in the SBA Directory as meeting the FTC definition, filed a California notice of exemption for 2026 rather than a registration, so its DFPI record holds no FDD (DFPI record).
Three of the four FDDs include an Item 19 financial performance representation; this page does not report those figures. See the site’s Item 19 research and initial investment dataset for how to read them, and the franchise costs guide for the cost categories.
| Brand | Format | FDD issued | Initial franchise fee ($) | Item 7 low ($) | Item 7 high ($) | Continuing royalty (Item 6) | Franchised outlets, end 2025 | Company or affiliate outlets, end 2025 | Item 19 included |
|---|---|---|---|---|---|---|---|---|---|
| CPR Cell Phone Repair | Phone and device repair | 2026-03-27 | 25,000 | 90,350 | 360,500 | 5.8% of Gross Volume (minimum royalty applies) | 418 | 1 | Yes |
| uBreakiFix by Asurion | Phone and device repair | 2026-04-02 | 40,000 | 171,350 | 468,150 | 7% of non-recommerce revenue; 4% of recommerce revenue | 549 | 128 | Yes |
| Techy | Phone and device repair | 2026-04-15 | 15,000 | 118,600 | 399,500 | 7% of gross revenues (6% in weeks above a sales threshold) | 151 | 4 | No |
| PayMore | Used and refurbished electronics retail | 2026-04-17 | 35,000 | 138,750 | 268,500 | greater of 5% of gross sales or $1,000 per month | 99 | 1 | Yes |
Original analysis: how we calculated it
1. Franchised share and owner type, NAICS 443142, 2007 to 2017
- Formula
franchise establishments / all establishments x 100; franchisor-owned / franchise x 100- Inputs
- C07_fr, C07_all, C12_fr, C12_all, C17_fr, C17_all, C17_sor
- Result
- 6.2% (2007), 8.2% (2012), 47.6% (2017); franchisor-owned 17.1% of franchise units in 2012 and 90.1% in 2017
- Limitations
- 2007 sums three NAICS 2007 codes; 2017 coverage range 10% to under 20%; non-franchise includes non-respondents.
2. Size per store, franchisee-owned vs non-franchise
- Formula
sales x 1000 / establishments for each group; ratio = franchisee-owned / non-franchise- Inputs
- C17_rcptot_fee, C17_fee, C17_rcptot_all, C17_rcptot_fr, C17_all, C17_fr
- Result
- $1,381,930 vs $3,473,053 per store in 2017 (ratio 0.40); 0.44 in 2012; 0.18 in 2007
- Limitations
- Averages; the non-franchise group mixes big-box chains with small independents.
3. SBA franchise-coded lending to the sector by year
- Formula
franchise-coded loans / all loans x 100 by fiscal year, NAICS scope in tbl-sba- Inputs
- S_fy2010_loans to S_fy2026_loans, S_fy2010_fr to S_fy2026_fr
- Result
- 6.4% FY2010 to FY2026 Q3 vs 10.0% for all SBA loans; 5.8% since FY2020
- Limitations
- Directory gap May 2023 to May 2025 lowers coding; NAICS 449210 adds appliance stores from FY2023.
4. Registry of coded programs, counts only
- Formula
loans per FOIA code, summed by program type- Inputs
- G_type_carrier_all, G_type_carrier_franchise_all, G_type_electronics_all, G_type_repair_all
- Result
- carrier agreements 39 loans; Wireless Zone 46; electronics retail franchises 301; repair franchises 108
- Limitations
- Program types assigned from code names; uncoded dealer loans are invisible.
5. Carrier store ownership mix from 10-Ks
- Formula
count of FY2025 carrier 10-Ks stating store counts by ownership- Inputs
- K_n_latest, K_n_counts, K_gme_spring, K_wcrs21
- Result
- 0 of 4; dealer-side filings show 1,329 AT&T stores (2018) and 229 Cricket stores (2021) run by two public dealers
- Limitations
- The ownership mix cannot be computed from current filings; historical dealer counts are not market totals.
6. Census vs QCEW size of the industry, 2017
- Formula
QCEW private establishments - Economic Census establishments- Inputs
- Q17_443142_est, C17_all
- Result
- 17,197 establishments
- Limitations
- Different frames; shows why 2012 to 2017 Census changes need caution.
Does the cell phone store franchise angle hold?
Partly. The claim that electronics and phone stores are among the most franchised retail formats by share holds only for 2017 Census store counts (47.6%, No. 2 of 58 retail industries), and that count is 90.1% franchisor-owned with the lowest coverage range. It does not hold by firm (1.6% of electronics and appliance firms in 2023) or in SBA lending (6.4% coded).
The second half of the claim, that the franchising runs mostly through carrier dealer and prepaid-brand programs, cannot be shown with Census data, because phone stores selling plans sit in a NAICS code the franchise file does not cover. The records that do exist point the other way: the SBA marks every listed carrier agreement as outside the FTC definition, and carrier-coded loans (39) are outnumbered by loans to electronics retail and repair franchises (301 and 108). The data support a narrower finding: carrier stores run on dealer and agent agreements that federal records do not count as franchises, while the measurable franchise layer is repair, used-electronics and battery brands plus one franchisor, Wireless Zone, whose older SBA codes carry a carrier name. For the wider franchise-versus-independent picture, see franchise vs independent business.
Update log
- 2026-10-18: first edition. Sources checked: SBA FOIA files as of 2026-06-30, SBA Franchise Directory of 2026-10-15, FY2025 10-K filings, 2026 FDDs, Annual Business Survey reference years 2019 to 2023, Economic Census 2007, 2012 and 2017.
- Next check: the SBA FOIA file as of 2026-09-30 (SBA posts quarterly files about one month after quarter end), the next weekly Directory files, and the Census release of the 2024 Annual Business Survey listed for 2026-12-03.
Key findings
- 10,992 of 23,078 U.S. electronics-store establishments (47.6%) were franchise units in 2017. Economic Census
- Electronics stores ranked 2 of 58 U.S. retail industries with 1,000+ establishments by franchise share in 2017, behind new car dealers. Economic Census
- 9,908 of the 10,992 franchise electronics stores (90.1%) were franchisor-owned in 2017, the highest franchisor-owned share among 33 large U.S. retail franchise industries. Economic Census
- The U.S. franchise share of electronics stores was 6.2% in 2007 and 8.2% in 2012. Economic Census
- Census rates 2017 franchise-inquiry coverage for U.S. electronics stores at 10% to less than 20% of sales, against 46.0% in 2012. Census 2017 data dictionary
- A franchisee-owned U.S. electronics store averaged $1,381,930 in 2017 sales, 0.40 times the $3,473,053 of a non-franchise store. Economic Census
- 1.6% of U.S. electronics and appliance retail firms operated as a franchise in 2023 (2024 ABS), against 8.5% of all retail firms. Annual Business Survey
- 192 of 3,018 U.S. SBA 7(a) and 504 loans to electronics retail and wireless-service businesses (6.4%) carried a franchise code, FY2010 to FY2026 Q3. SBA FOIA loan data
- 39 U.S. SBA loans from FY2010 to FY2026 Q3 were coded to carrier or prepaid-brand dealer programs, fewer than the 46 coded to Wireless Zone. SBA FOIA loan data
- All 7 carrier agreements in the SBA Franchise Directory of 2026-10-15 are marked as not meeting the FTC definition of a franchise. SBA Franchise Directory
- 1,009 of 3,498 SBA Franchise Directory listings (28.8%) were marked as not meeting the FTC franchise definition on 2026-10-15. SBA Franchise Directory
- 0 of 4 FY2025 10-Ks from AT&T, T-Mobile, Verizon and EchoStar state store counts split between company stores and dealers. SEC EDGAR 10-K filings
- Item 7 initial investment in four 2026 U.S. phone, repair and electronics FDDs ranges from $90,350 to $468,150. FDDs (Minnesota CARDS, California DFPI)
- The FTC Franchise Rule excludes payments for reasonable inventory at bona fide wholesale prices and exempts relationships with under $735 in required payments in the first six months. 16 CFR Part 436
Summary
- In 2017, 47.6% of U.S. electronics-store establishments were franchise units, the second-highest share among 58 large retail industries, according to the 2017 Economic Census.
- 90.1% of those franchise stores were franchisor-owned; franchisee-owned stores were 4.7% of all electronics stores in 2017.
- The 2017 jump (from 8.2% in 2012) comes with a franchise-inquiry coverage range of 10% to less than 20% of sales, so it is the least certain figure in the series.
- Phone stores that mainly sell carrier plans are classified outside NAICS 443142 (517312 in NAICS 2017; 517122 for agent stores in NAICS 2022), and the Census franchise file does not cover them.
- All 7 carrier and prepaid-brand agreements in the SBA Franchise Directory of 2026-10-15 are marked as not meeting the FTC franchise definition.
- Only 6.4% of 3,018 SBA loans to electronics retail and wireless-service businesses (FY2010 to FY2026 Q3) carried a franchise code, against 10.0% of all SBA loans.
- Current FDDs for phone repair and used-electronics franchises show Item 7 investment from $90,350 to $468,150; carrier dealer programs file no FDD.
Questions people ask
Can you franchise a cell phone store?
Yes, but mostly through repair and used-electronics brands, not through the carriers themselves. The SBA Franchise Directory of 2026-10-15 marks Wireless Zone, CPR Cell Phone Repair, Techy, PayMore and Batteries Plus as meeting the FTC franchise definition, and marks all 7 carrier agreements it lists as not meeting it (SBA Franchise Directory). Carrier stores are run by the carrier or by dealers. The buying a franchise guide covers the steps for the franchise route.
What is an authorized wireless retailer?
An authorized wireless retailer is a business that sells a carrier’s plans and devices under a dealer or agent agreement. NAICS 2022 code 517122 defines agents for wireless carriers as businesses acting as agents for wireless telecommunications carriers and resellers, selling wireless plans on a commission basis (Census NAICS 2022). Verizon says most of its agent sales are made under exclusive selling arrangements (Verizon 10-K, FY2025).
How much does it cost to open a cell phone store franchise?
Current FDDs put the Item 7 initial investment at $90,350 to $360,500 for CPR Cell Phone Repair, $118,600 to $399,500 for Techy, $138,750 to $268,500 for PayMore and $171,350 to $468,150 for uBreakiFix by Asurion (2026 FDDs, Minnesota CARDS and California DFPI). Carrier dealer programs file no FDD, so no public Item 7 figure exists for them.
Is a carrier dealer agreement a franchise?
Not by the SBA’s reading of the agreements it has reviewed: all 7 carrier agreements in the Directory are marked N (SBA Franchise Directory). Under the FTC Rule, an agreement is a franchise only with a trademark, significant control or assistance and a required payment, and inventory bought at bona fide wholesale prices does not count as a payment (16 CFR 436.1). This is not legal advice; the answer depends on the contract.
Can you get an SBA loan for a cell phone store?
Yes. Lenders approved 1,026 SBA 7(a) and 504 loans to electronics retail and wireless-service businesses from FY2020 to FY2026 Q3, and 14 loans in that period carried a carrier-program code (SBA FOIA data). Franchise brands that meet the FTC definition must be in the SBA Directory to obtain SBA financing (SBA). See the site’s SBA franchise loan research.
Frequently asked questions
What share of U.S. electronics stores are franchises?
47.6% of U.S. electronics-store establishments (NAICS 443142) were franchise units in 2017, the latest Census franchise tabulation (2017 Economic Census).
Are most franchise electronics stores owned by franchisees?
No. In 2017, 9,908 of 10,992 U.S. franchise electronics stores (90.1%) were franchisor-owned and 1,084 were franchisee-owned (2017 Economic Census).
Why did the electronics-store franchise share jump between 2012 and 2017?
The Census file does not say. The share rose from 8.2% to 47.6% while total establishments in the Census count fell 43.0%, and 2017 inquiry coverage was 10% to less than 20% of sales (Census data dictionary).
Is there 2022 Census franchise data for cell phone stores?
No. The 2022 Economic Census release list includes a franchise-status table for Puerto Rico only, so 2017 is the latest U.S. tabulation (Census 2022 releases).
Are franchise electronics stores bigger than independent ones?
Franchisee-owned stores were smaller on average: $1,381,930 in 2017 sales and 8.7 employees, against $3,473,053 and 12.0 for non-franchise stores (2017 Economic Census).
What share of electronics retail firms operate as franchises?
1.6% of U.S. electronics and appliance retail firms in reference year 2023, standard error 0.5 points, against 8.5% of all retail firms (2024 Annual Business Survey).
How many SBA loans went to carrier dealer programs?
39 U.S. SBA 7(a) and 504 loans from FY2010 to FY2026 Q3 carried a carrier or prepaid-brand program code, worth $24,275,200 in gross approvals (SBA FOIA data).
Which phone-related brands are in the SBA Franchise Directory?
On 2026-10-15 the Directory listed Wireless Zone, CPR Cell Phone Repair, Techy, PayMore and Batteries Plus as meeting the FTC definition, and 7 carrier agreements as not meeting it; uBreakiFix was not listed (SBA Franchise Directory).
Do carrier 10-Ks report how many stores dealers run?
Not in the latest filings: 0 of 4 FY2025 10-Ks from AT&T, T-Mobile, Verizon and EchoStar split store counts by ownership. T-Mobile’s FY2018 10-K listed about 2,200 leased retail locations (T-Mobile 10-K).
How many outlets do the largest phone repair franchises have?
At the end of 2025, uBreakiFix by Asurion reported 549 franchised and 128 company or affiliate outlets, and CPR Cell Phone Repair 418 franchised outlets, in Item 20 of their 2026 FDDs (uBreakiFix FDD, CPR FDD).
For journalists
Most quotable statistics
In 2017, 47.6% of U.S. electronics-store establishments were franchise units, but 90.1% of those were owned by the franchisor, not a franchisee.
2017 Economic CensusAll 7 carrier and prepaid-brand agreements in the SBA Franchise Directory of 2026-10-15 are marked as not meeting the FTC definition of a franchise.
SBA Franchise DirectoryFrom FY2020 to FY2026 Q3, 5.8% of U.S. SBA loans to electronics retail and wireless-service businesses carried a franchise code, against 11.7% of all SBA loans.
SBA FOIA, as of 2026-06-301.6% of U.S. electronics and appliance retail firms operated as a franchise in 2023, against 8.5% of all retail firms.
Annual Business Survey 2024A franchisee-owned U.S. electronics store averaged $1,381,930 in 2017 sales, 0.40 times the average non-franchise store.
2017 Economic Census0 of 4 FY2025 10-Ks from the U.S. national carriers state how many stores dealers run.
SEC EDGAR
If you cite only a few, cite these
- 47.6% of U.S. electronics stores were franchise units in 2017; 90.1% of them were franchisor-owned (2017 Economic Census). source
- All 7 carrier agreements in the SBA Franchise Directory (2026-10-15) are marked as outside the FTC franchise definition. source
- 5.8% of SBA loans to electronics and wireless retail carried a franchise code, FY2020 to FY2026 Q3, vs 11.7% for all SBA loans (SBA FOIA). source
Press summary and suggested headlines
A new tracker from Franchise Consultants and Brokers tests how much U.S. cell phone and electronics retail runs under franchise agreements. The 2017 Economic Census, the latest U.S. franchise tabulation, counted 10,992 franchise electronics stores, 47.6% of the industry and the second-highest share in large retail industries. But 90.1% of those stores were franchisor-owned, Census rated response coverage at 10% to less than 20% of sales, and the share was 8.2% in 2012. Phone stores that mainly sell carrier plans are classified in a wireless code that the Census franchise file does not cover. SBA records show the carrier side runs on dealer agreements: all 7 carrier agreements in the SBA Franchise Directory are marked as not meeting the FTC franchise definition, and only 39 SBA loans since FY2010 carried a carrier-program code. Franchise-coded loans were 5.8% of SBA lending to the sector since FY2020, against 11.7% for all SBA loans. Current FDDs for phone repair and used-electronics franchises put the initial investment at $90,350 to $468,150.
Suggested headlines
- Census: 47.6% of electronics stores were franchise units in 2017, but 90.1% were franchisor-owned
- SBA marks all 7 carrier dealer agreements it lists as outside the FTC franchise definition
- Only 39 SBA loans since FY2010 went to carrier dealer program codes
- Electronics retail firms franchise at 1.6%, a fraction of the 8.5% retail rate
- Phone repair franchise FDDs show $90,350 to $468,150 startup ranges in 2026
Methodology
Question and scope. The report measures franchise and dealer activity in U.S. phone and electronics retail with public records only: the Economic Census franchise files (2007, 2012, 2017), the Annual Business Survey (reference years 2019 to 2023), SBA 7(a) and 504 FOIA loan files as of 2026-06-30, the SBA Franchise Directory of 2026-10-15, the FTC Franchise Rule (16 CFR Part 436, eCFR as of 2026-10-01), 10-K filings on SEC EDGAR, four 2026 FDDs, and BLS QCEW for industry size.
Definitions. Electronics stores = NAICS 443142 (2012 and 2017); for 2007 the three NAICS 2007 codes mapped into it (443112, 443120, 443130) are summed. SBA scope = loans whose NAICS is an electronics retail code (443112, 443120, 443130, 443142, 449210) or a wireless-service code (517210, 517312, 517112, 517911, 517121, 517122). Franchise-coded = a non-blank FranchiseCode. Carrier programs = codes whose names identify a carrier or prepaid-brand dealer, agent, retailer, operator or sublicense agreement (scripts/registry_def.py).
Inclusion and exclusion. Registry entries were found by listing every franchise code on loans in the scope codes and every FOIA name or Directory brand that matches carrier and phone keywords; name collisions and listings whose line of business cannot be confirmed were dropped (excluded.md). Borrower names and addresses were never loaded; the registry shows counts only. Item 19 figures are not reported.
Conflicts. Census and QCEW disagree on the 2017 size of the industry; both are shown with their frames. Market-research estimates of phone retail were not used. Two pages that rank for the keyword quote CPR investment ranges from older FDDs; this report uses the FDD issued 2026-03-27.
Derived metrics. Shares, averages, ranks and changes are computed in scripts/01 to 07 and listed in derived.csv with their input fact ids. Ranks use 6-digit industries with at least 1,000 establishments.
Limitations. 2017 franchise-inquiry coverage for electronics stores is 10% to under 20% of sales. Non-franchise counts include non-respondents. The SBA Franchise Directory gap (2023-05-11 to 2025-05-31) lowers franchise coding. NAICS 449210 adds appliance stores from FY2023 loans and 2022 data. Carrier filings give no store counts by ownership. Last updated 2026-10-18.
Sources and source quality
Tier 1: primary and government sources (39)
- Wireless Zone LLC, DFPI franchise filing record (notice NOT00017421, 31101 exemption, calendar year 2026), California Department of Financial Protection and Innovation (accessed 2026-10-18)
- PayMore Franchise Disclosure Document (PayMore Group LLC), issued 2026-04-17, California DFPI application APP00005060, California Department of Financial Protection and Innovation (franchisor filing) (accessed 2026-10-18)
- Franchise Rule Compliance Guide (May 2008), Federal Trade Commission (accessed 2026-10-18)
- 16 CFR Part 436, Disclosure Requirements and Prohibitions Concerning Franchising (eCFR, as of 2026-10-01), Federal Trade Commission, Electronic Code of Federal Regulations (accessed 2026-10-18)
- CPR Cell Phone Repair Franchise Disclosure Document (MMI-CPR, LLC), issued 2026-03-27, Minnesota CARDS document 35632-202603-07, Minnesota Department of Commerce, CARDS franchise registrations (franchisor filing) (accessed 2026-10-18)
- Techy Franchise Disclosure Document (Techy, LLC), issued 2026-04-15 as amended 2026-04-22, Minnesota CARDS document 36348-202604-09, Minnesota Department of Commerce, CARDS franchise registrations (franchisor filing) (accessed 2026-10-18)
- uBreakiFix by Asurion Franchise Disclosure Document (UBIF Franchising Co), issued 2026-04-02, Minnesota CARDS document 35808-202604-10, Minnesota Department of Commerce, CARDS franchise registrations (franchisor filing) (accessed 2026-10-18)
- QCEW annual averages 2014, NAICS 443142, U.S. Bureau of Labor Statistics (accessed 2026-10-18)
- QCEW annual averages 2017, NAICS 443142, U.S. Bureau of Labor Statistics (accessed 2026-10-18)
- QCEW annual averages 2017, NAICS 517312, U.S. Bureau of Labor Statistics (accessed 2026-10-18)
- QCEW annual averages 2021, NAICS 443142, U.S. Bureau of Labor Statistics (accessed 2026-10-18)
- QCEW annual averages 2022, NAICS 449210, U.S. Bureau of Labor Statistics (accessed 2026-10-18)
- QCEW annual averages 2022, NAICS 51712, U.S. Bureau of Labor Statistics (accessed 2026-10-18)
- QCEW annual averages 2025, NAICS 449210, U.S. Bureau of Labor Statistics (accessed 2026-10-18)
- QCEW annual averages 2025, NAICS 51712, U.S. Bureau of Labor Statistics (accessed 2026-10-18)
- 2007 Economic Census, Franchise Status (EC0700CFRA1), bulk file, U.S. Census Bureau (accessed 2026-10-18)
- 2012 Economic Census, Franchise Status (EC1200CFRA1), bulk file, U.S. Census Bureau (accessed 2026-10-18)
- 2012 NAICS to 2007 NAICS concordance, U.S. Census Bureau (accessed 2026-10-18)
- 2017 Economic Census data dictionary (flag and range codes), U.S. Census Bureau (accessed 2026-10-18)
- 2017 Economic Census, Franchise Status for the U.S. (EC1700FRAN), bulk file, U.S. Census Bureau (accessed 2026-10-18)
- 2017 NAICS index file (2017_NAICS_Index_File.xlsx), U.S. Census Bureau (accessed 2026-10-18)
- 2022 Economic Census data releases (table list), U.S. Census Bureau (accessed 2026-10-18)
- 2022 NAICS descriptions (2022_NAICS_Descriptions.xlsx), U.S. Census Bureau (accessed 2026-10-18)
- 2022 NAICS index file (2022_NAICS_Index_File.xlsx), U.S. Census Bureau (accessed 2026-10-18)
- 2022 NAICS to 2017 NAICS concordance, U.S. Census Bureau (accessed 2026-10-18)
- Annual Business Survey 2020 (reference year 2019), Characteristics of Businesses (AB1900CSCB01), U.S. Census Bureau (accessed 2026-10-18)
- Annual Business Survey 2021 (reference year 2020), Characteristics of Businesses (AB2000CSCB01), U.S. Census Bureau (accessed 2026-10-18)
- Annual Business Survey 2022 (reference year 2021), Characteristics of Businesses (AB2100CSCB01), U.S. Census Bureau (accessed 2026-10-18)
- Annual Business Survey 2023 (reference year 2022), Characteristics of Businesses (AB2200CSCB01), U.S. Census Bureau (accessed 2026-10-18)
- Annual Business Survey 2024 (reference year 2023), Characteristics of Businesses (AB2300CSCB01), U.S. Census Bureau (accessed 2026-10-18)
- Annual Business Survey methodology (2024 ABS), U.S. Census Bureau (accessed 2026-10-18)
- New Franchise Statistics Report From 2017 Economic Census (tip sheet CB21.TPS.95, 2021-08-26), U.S. Census Bureau (accessed 2026-10-18)
- Upcoming data releases (census.gov), U.S. Census Bureau (accessed 2026-10-18)
- Information Notice 5000-866746, Issuance of SOP 50 10 8, U.S. Small Business Administration (accessed 2026-10-18)
- SBA 7(a) and 504 FOIA loan data, files as of June 30, 2026, U.S. Small Business Administration (accessed 2026-10-18)
- SBA Franchise Directory, effective October 15, 2026 (xlsx), U.S. Small Business Administration (accessed 2026-10-18)
- SBA Franchise Directory: purpose and eligibility, U.S. Small Business Administration (accessed 2026-10-18)
- Support: SBA Franchise Directory (download page, last updated October 15, 2026), U.S. Small Business Administration (accessed 2026-10-18)
- Final rule, Affiliation and Lending Criteria for the SBA Business Loan Programs (88 FR, 2023-04-10), U.S. Small Business Administration, Federal Register (accessed 2026-10-18)
Tier 2: trade bodies, market research, company filings (9)
- AT&T Inc. Form 10-K for fiscal year 2025 (filed 2026-02-09), AT&T Inc. via SEC EDGAR (accessed 2026-10-18)
- EchoStar Corporation Form 10-K for fiscal year 2025 (filed 2026-03-02), EchoStar Corporation via SEC EDGAR (accessed 2026-10-18)
- GameStop Corp. Form 10-K for fiscal 2017 (filed 2018-04-02), GameStop Corp. via SEC EDGAR (accessed 2026-10-18)
- GameStop Corp. Form 10-K for fiscal 2018 (filed 2019-04-02), GameStop Corp. via SEC EDGAR (accessed 2026-10-18)
- T-Mobile US, Inc. Form 10-K for fiscal year 2018 (filed 2019-02-07), T-Mobile US, Inc. via SEC EDGAR (accessed 2026-10-18)
- T-Mobile US, Inc. Form 10-K for fiscal year 2025 (filed 2026-02-11), T-Mobile US, Inc. via SEC EDGAR (accessed 2026-10-18)
- Verizon Communications Inc. Form 10-K for fiscal year 2025 (filed 2026-02-17), Verizon Communications Inc. via SEC EDGAR (accessed 2026-10-18)
- Western Capital Resources, Inc. Form 10-K for fiscal year 2017 (filed 2018-03-29), Western Capital Resources, Inc. via SEC EDGAR (accessed 2026-10-18)
- Western Capital Resources, Inc. Form 10-K for fiscal year 2021 (filed 2022-03-29), Western Capital Resources, Inc. via SEC EDGAR (accessed 2026-10-18)
Related research
Education Franchise Statistics
37.1% of US exam preparation and tutoring establishments were franchised in 2017 (rank 10 of 267 industries)
Read the research
Pet Franchise Statistics
4.7% of US pet care establishments (NAICS 812910) were franchise units in 2017, up from 2.2% in 2007; veterinary: 0.5%
Read the research
Restaurant Franchise Statistics
57.3% of U.S. limited-service restaurant establishments were franchises (2017)
Read the research
SBA Franchise Loans by State
2.09: Franchise 7(a) loans per 100,000 residents per year, US, Oct 2021 to Apr 2023 and FY2026 through June 30, 2026
Read the researchHow to cite and reuse
Franchise Consultants and Brokers Editorial Team. "Cell Phone Store Franchise Statistics: Census, SBA and Carrier Dealer Records." Franchise Consultants and Brokers, updated October 18, 2026. https://franchiseconsultantsandbrokers.com/research/cell-phone-store-franchise-statistics/
The data tables and charts on this page are licensed under CC BY 4.0. Please credit “Franchise Consultants and Brokers, franchiseconsultantsandbrokers.com” with a link to this page.
Download the data
- Electronics stores (NAICS 443142) by franchise status, United States, 2007, 2012 and 2017 (CSV)
- Average size of an electronics store by franchise status, United States, 2007, 2012 and 2017 (CSV)
- Share of employer firms operating as a franchise, electronics and appliance retail vs all retail, United States, reference years 2019 to 2023 (CSV)
- SBA 7(a) and 504 loans to electronics retail and wireless-service businesses by fiscal year, United States, FY2010 to FY2026 (three quarters) (CSV)
- Current FDDs of phone, device and electronics franchise systems: fees, Item 7 investment and outlets, United States, 2026 disclosure documents (CSV)
- What carrier and dealer 10-K filings state about store ownership, United States, FY2017 to FY2025 (CSV)
- Registry of coded wireless and electronics programs (CSV)
- Franchise share of electronics-store establishments, United States, 2007, 2012 and 2017 (chart data, CSV)
- Electronics-store establishments by owner type, United States, 2007, 2012 and 2017 (chart data, CSV)
- Sales per electronics store: franchisee-owned vs non-franchise, United States, 2007, 2012 and 2017 (chart data, CSV)
- Franchise-coded share of SBA loans: electronics retail and wireless-service businesses vs all SBA loans, United States, FY2010 to FY2026 (chart data, CSV)
- Share of employer firms operating as a franchise: electronics and appliance retail vs all retail, United States, reference years 2019 to 2023 (chart data, CSV)
- SBA loans by coded program type, wireless and electronics retail registry, United States, FY2010 to FY2026 (chart data, CSV)
- Full fact sheet with sources (CSV)