Convenience Store Franchise Statistics: Gas Stations, Fuel Brands and SBA Loans
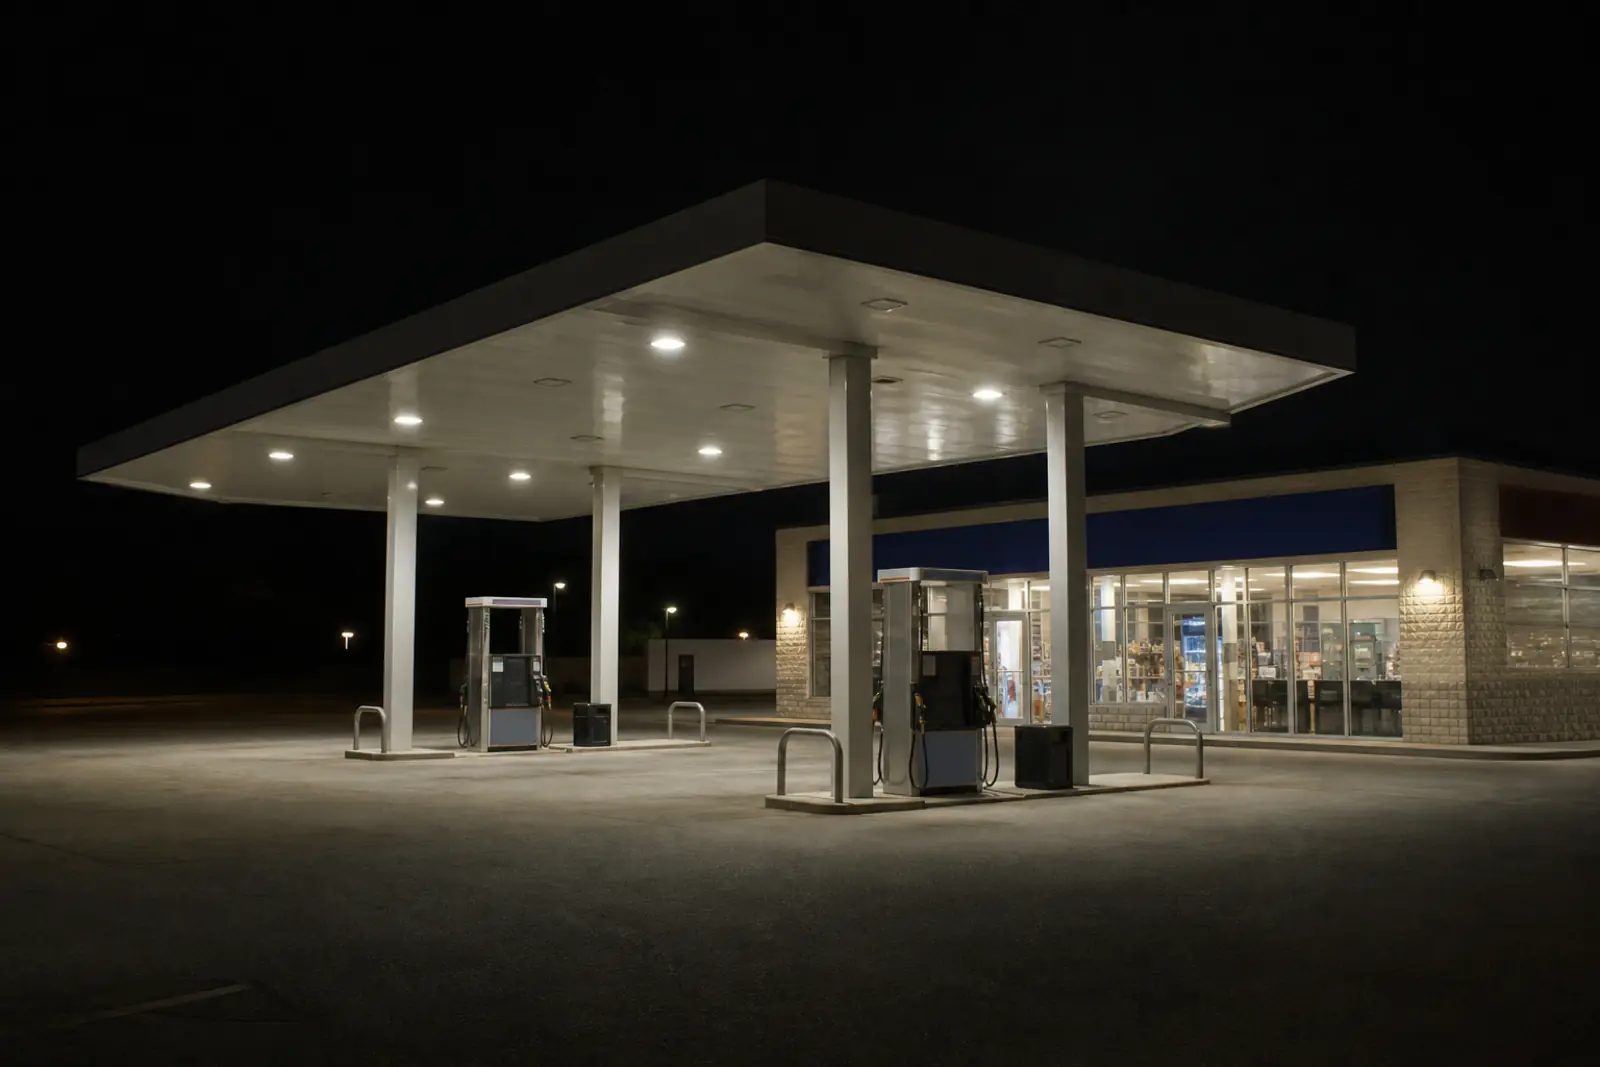
Convenience store franchise statistics from the 2017 Economic Census, the latest U.S. count, show 18.0% of gas stations with convenience stores and 18.6% of convenience stores were franchises. In April to June 2026, SBA lenders made 82 franchise-coded loans to the sector worth $179.1 million, with a median of $1,778,600.
This edition
- 2026-10-14: SBA’s FOIA files are still dated June 30, 2026 (SBA FOIA data); FY2026 Q3 shows 82 franchise-coded c-store sector loans, up from 54 in FY2025 Q3.
- 2026-10-09: SBA’s weekly Franchise Directory file lists 164 fuel supply and branding codes and 5 convenience store codes (Directory file).
- 2026-10-01: SOP 50 10 8.1 took effect; it requires Phase I environmental reviews for NAICS 457 gas station loans and treats PMPA fuel agreements as franchises for SBA purposes (SOP 50 10 8.1).
- 2026-09-01: TA Center and TA Express FDDs were amended; TA Center reported 33 franchised and 153 company-owned centers at December 31, 2025 (TA Center FDD).
- 2026-07-10: Circle K issued two FDDs; the store franchise FDD reports 515 franchised stores at April 26, 2026 (Circle K FDD).
- 2026-04-02: Marathon Petroleum issued Minnesota public offering statements for ARCO, Marathon and Tesoro, Exxon and Mobil, and Shell motor fuel franchises (Minnesota CARDS).
- 2025-11-13: SBA said its lending programs were unavailable during a 43-day federal shutdown; the FOIA files contain no October 2025 approvals (SBA release).
This edition in brief
- Latest quarter: 82 franchise-coded SBA loans to U.S. gas stations and convenience stores in April to June 2026 ($179.1 million), up from 54 a year earlier, partly because coding recovered after SBA restored its Franchise Directory.
- Census counted 17,782 franchise gasoline stations with convenience stores in 2017, 18.0% of the industry, the 2nd-largest franchise count in retail; 2022 was not tabulated for the U.S.
- Firm survey data agree on scale: 16.7% of responding gasoline station firms were franchises in 2023 (2024 ABS), 5 of 174 industries and twice the retail share.
- Fuel brand agreements governed by the PMPA, not store franchises, dominate SBA coding: 83.3% of franchise-coded c-store loans and 164 of the Directory’s codes against 5 store codes.
- Gas stations with c-stores drew $4.48 billion of franchise-coded SBA loans from FY2020 to June 2026, second only to hotels, at a median of $1,461,150.
- Franchise convenience stores averaged 2.27 times the receipts of non-franchise stores in 2017; franchise and non-franchise gas stations were close (0.96).
- SBA c-store franchise loans are concentrated: California, Texas and Washington held 51.3% of them from FY2020 to June 2026.
- In 2025 to 2026 filings, Circle K reported 515 franchised stores against 5,556 company-owned; fuel brand franchisors filed state offering statements, not FTC FDDs.
Convenience store franchise statistics: SBA lending, April to June 2026
Summary. SBA lending to franchised gas stations and convenience stores rose in the most recent quarter of SBA data. From April 1 to June 30, 2026 (FY2026 Q3), lenders approved 82 SBA 7(a) and 504 loans to U.S. gas stations and convenience stores that carried a franchise code, worth $179.1 million, against 54 loans worth $128.4 million in April to June 2025 (SBA FOIA data). Part of that rise is a coding effect, not new borrowers: April and May 2025 still fell inside the period when SBA did not publish its Franchise Directory.
Gasoline stations with convenience stores made up 75 of the 82 franchise-coded loans in FY2026 Q3. Convenience stores without fuel had 6 and other gasoline stations had 1. The median franchise-coded c-store sector loan was $1,778,600 in FY2026 Q3, 3.7 times the $486,500 median franchise-coded SBA loan across all industries in the same quarter. The c-store sector took 4.2% of all franchise-coded SBA loans but 9.4% of the dollars.
For the fiscal year to date (October 1, 2025 to June 30, 2026), franchise-coded loans to the sector reached 259, worth $519.2 million, compared with 142 in the same months a year earlier, when the Directory gap still suppressed coding. No SBA loan in the files carries an October 2025 approval date: SBA said its loan programs were unavailable during the 43-day federal shutdown that fall (SBA, November 13, 2025). The program-wide picture of franchise lending sits in SBA franchise loans; this report covers the c-store slice only.
| Measure | FY2026 Q3 (Apr to Jun 2026) | FY2025 Q3 (Apr to Jun 2025) |
|---|---|---|
| C-store sector SBA loans, 7(a) plus 504 | 210 | 241 |
| Franchise-coded c-store sector loans, 7(a) plus 504 | 82 | 54 |
| Franchise-coded c-store sector loans, 7(a) | 69 | 42 |
| Franchise-coded c-store sector loans, 504 | 13 | 12 |
| Franchise-coded c-store sector dollars, 7(a) plus 504 ($ million) | 179.1 | 128.4 |
| Franchise-coded loans: gas stations with convenience stores | 75 | 51 |
| Franchise-coded loans: other gas stations | 1 | 1 |
| Franchise-coded loans: convenience stores without fuel | 6 | 2 |
| Median franchise-coded c-store sector loan ($) | 1,778,600 | 2,183,000 |
| Median franchise-coded loan, all industries ($) | 486,500 | 385,100 |
| Franchise-coded share of c-store sector loans (%) | 39 | 22.4 |
| C-store sector share of all franchise-coded loan dollars (%) | 9.4 | 8.5 |
Quarterly SBA franchise loans to gas stations and convenience stores, FY2015 to FY2026
Summary. The quarterly series is shaped as much by SBA’s coding rules as by lending demand. In FY2015 only 14.4% of SBA 7(a) loans to the c-store sector carried a franchise code (172 loans). After SBA’s Franchise Directory was created with SOP 50 10 5(J), effective January 1, 2018 (Taft law bulletin), the coded share climbed to 46.6% in FY2021 (614 loans).
SBA stopped publishing the Directory when its affiliation rule took effect on May 11, 2023 (88 FR 21074), and SOP 50 10 8 reintroduced it effective June 1, 2025 (SBA SOP version history). Over the same windows, the franchise-coded share of c-store sector loans (7(a) plus 504) was 49.3% from October 2021 to May 10, 2023, 17.4% from October 2023 to February 2025 and 39.2% from June 2025 to June 2026 (SBA FOIA data). The coded share for all industries moved the same way (13.3%, 7.8% and 13.2%), which is why the dip reads as a recording gap rather than a collapse in franchise lending. The SBA Franchise Directory report documents the Directory’s history.
The 504 program codes a larger share of c-store loans as franchise loans than 7(a): 57.5% against 35.9% from FY2020 to June 30, 2026. Quarterly counts are small in 504 (often under 20 loans), so single quarters swing widely.
| Fiscal quarter | Program | C-store sector loans | Franchise-coded c-store loans | Franchise-coded dollars ($ million) | Median franchise-coded c-store loan ($) | Median franchise-coded loan, all industries ($) | Franchise-coded share of c-store loans (%) |
|---|---|---|---|---|---|---|---|
| FY2015 Q1 | 7(a) | 262 | 33 | 45.2 | 980,000 | 270,200 | 12.6 |
| FY2015 Q1 | 504 | 23 | 5 | 3.6 | 930,000 | 805,000 | 21.7 |
| FY2015 Q2 | 7(a) | 256 | 41 | 62.2 | 1,244,500 | 281,300 | 16 |
| FY2015 Q2 | 504 | 31 | 3 | 3.3 | 792,000 | 704,000 | 9.7 |
| FY2015 Q3 | 7(a) | 292 | 37 | 52.4 | 1,150,000 | 298,000 | 12.7 |
| FY2015 Q3 | 504 | 26 | 5 | 5.3 | 876,000 | 836,500 | 19.2 |
| FY2015 Q4 | 7(a) | 386 | 61 | 81.1 | 965,000 | 314,000 | 15.8 |
| FY2015 Q4 | 504 | 23 | 6 | 4.9 | 709,000 | 757,000 | 26.1 |
| FY2016 Q1 | 7(a) | 247 | 47 | 66.5 | 1,280,000 | 296,500 | 19 |
| FY2016 Q1 | 504 | 20 | 4 | 7.1 | 1,136,500 | 1,069,000 | 20 |
| FY2016 Q2 | 7(a) | 242 | 38 | 47.6 | 1,063,750 | 277,000 | 15.7 |
| FY2016 Q2 | 504 | 19 | 5 | 3.1 | 460,000 | 855,500 | 26.3 |
| FY2016 Q3 | 7(a) | 332 | 38 | 52.7 | 1,114,250 | 300,000 | 11.4 |
| FY2016 Q3 | 504 | 15 | 5 | 2 | 323,000 | 807,000 | 33.3 |
| FY2016 Q4 | 7(a) | 262 | 32 | 67.1 | 1,926,350 | 288,500 | 12.2 |
| FY2016 Q4 | 504 | 24 | 4 | 3.6 | 785,000 | 1,028,000 | 16.7 |
| FY2017 Q1 | 7(a) | 297 | 50 | 70.4 | 1,181,600 | 300,000 | 16.8 |
| FY2017 Q1 | 504 | 24 | 5 | 2.7 | 575,000 | 935,000 | 20.8 |
| FY2017 Q2 | 7(a) | 241 | 44 | 55.6 | 1,362,500 | 305,100 | 18.3 |
| FY2017 Q2 | 504 | 28 | 7 | 4.2 | 742,000 | 976,500 | 25 |
| FY2017 Q3 | 7(a) | 278 | 34 | 52.3 | 1,225,050 | 294,500 | 12.2 |
| FY2017 Q3 | 504 | 34 | 12 | 12.4 | 622,000 | 949,500 | 35.3 |
| FY2017 Q4 | 7(a) | 302 | 52 | 73.3 | 1,201,200 | 300,000 | 17.2 |
| FY2017 Q4 | 504 | 30 | 5 | 4.7 | 1,094,000 | 969,000 | 16.7 |
| FY2018 Q1 | 7(a) | 287 | 44 | 59.9 | 1,241,500 | 311,000 | 15.3 |
| FY2018 Q1 | 504 | 30 | 5 | 4.7 | 695,000 | 1,167,500 | 16.7 |
| FY2018 Q2 | 7(a) | 198 | 43 | 73.7 | 1,560,000 | 295,000 | 21.7 |
| FY2018 Q2 | 504 | 24 | 10 | 10 | 796,000 | 861,000 | 41.7 |
| FY2018 Q3 | 7(a) | 244 | 95 | 166.9 | 1,506,900 | 303,500 | 38.9 |
| FY2018 Q3 | 504 | 14 | 11 | 10.6 | 669,000 | 918,000 | 78.6 |
| FY2018 Q4 | 7(a) | 245 | 83 | 118.8 | 1,245,000 | 300,000 | 33.9 |
| FY2018 Q4 | 504 | 28 | 12 | 5.6 | 332,000 | 891,500 | 42.9 |
| FY2019 Q1 | 7(a) | 235 | 110 | 135 | 955,850 | 338,400 | 46.8 |
| FY2019 Q1 | 504 | 21 | 14 | 14.7 | 978,000 | 1,124,500 | 66.7 |
| FY2019 Q2 | 7(a) | 196 | 66 | 84.4 | 1,020,500 | 322,500 | 33.7 |
| FY2019 Q2 | 504 | 20 | 12 | 8 | 605,500 | 838,500 | 60 |
| FY2019 Q3 | 7(a) | 228 | 99 | 167.5 | 1,360,000 | 315,000 | 43.4 |
| FY2019 Q3 | 504 | 30 | 19 | 9.7 | 398,000 | 948,500 | 63.3 |
| FY2019 Q4 | 7(a) | 250 | 96 | 139.3 | 1,067,500 | 316,750 | 38.4 |
| FY2019 Q4 | 504 | 24 | 13 | 14.1 | 977,000 | 935,000 | 54.2 |
| FY2020 Q1 | 7(a) | 213 | 100 | 161.4 | 1,356,000 | 343,050 | 46.9 |
| FY2020 Q1 | 504 | 20 | 14 | 11.9 | 652,500 | 1,050,000 | 70 |
| FY2020 Q2 | 7(a) | 175 | 68 | 98.3 | 1,159,500 | 350,000 | 38.9 |
| FY2020 Q2 | 504 | 26 | 22 | 16.7 | 456,500 | 1,158,000 | 84.6 |
| FY2020 Q3 | 7(a) | 181 | 77 | 132.5 | 1,548,000 | 328,200 | 42.5 |
| FY2020 Q3 | 504 | 26 | 17 | 13.5 | 779,000 | 752,500 | 65.4 |
| FY2020 Q4 | 7(a) | 302 | 165 | 256.8 | 1,141,500 | 470,000 | 54.6 |
| FY2020 Q4 | 504 | 34 | 21 | 11.9 | 411,000 | 777,000 | 61.8 |
| FY2021 Q1 | 7(a) | 217 | 100 | 174.7 | 1,558,400 | 350,000 | 46.1 |
| FY2021 Q1 | 504 | 41 | 30 | 34.7 | 922,500 | 824,000 | 73.2 |
| FY2021 Q2 | 7(a) | 230 | 121 | 172 | 1,123,900 | 359,750 | 52.6 |
| FY2021 Q2 | 504 | 33 | 25 | 29.2 | 843,000 | 722,500 | 75.8 |
| FY2021 Q3 | 7(a) | 289 | 128 | 226.3 | 1,481,150 | 409,000 | 44.3 |
| FY2021 Q3 | 504 | 29 | 20 | 21 | 902,500 | 772,000 | 69 |
| FY2021 Q4 | 7(a) | 583 | 265 | 491.9 | 1,520,000 | 514,750 | 45.5 |
| FY2021 Q4 | 504 | 36 | 23 | 25.3 | 994,000 | 912,000 | 63.9 |
| FY2022 Q1 | 7(a) | 136 | 56 | 91.2 | 1,199,150 | 317,200 | 41.2 |
| FY2022 Q1 | 504 | 47 | 39 | 40.4 | 833,000 | 1,031,500 | 83 |
| FY2022 Q2 | 7(a) | 171 | 89 | 150 | 1,412,300 | 350,000 | 52 |
| FY2022 Q2 | 504 | 42 | 30 | 29.7 | 838,500 | 1,158,000 | 71.4 |
| FY2022 Q3 | 7(a) | 225 | 99 | 193.1 | 1,900,000 | 367,000 | 44 |
| FY2022 Q3 | 504 | 10 | 9 | 12.3 | 1,270,000 | 1,113,000 | 90 |
| FY2022 Q4 | 7(a) | 216 | 100 | 186.3 | 1,515,950 | 406,500 | 46.3 |
| FY2022 Q4 | 504 | 27 | 18 | 23.8 | 1,046,500 | 1,104,500 | 66.7 |
| FY2023 Q1 | 7(a) | 190 | 93 | 196.6 | 1,700,000 | 350,000 | 48.9 |
| FY2023 Q1 | 504 | 26 | 21 | 38 | 1,245,000 | 1,428,000 | 80.8 |
| FY2023 Q2 | 7(a) | 167 | 66 | 151.2 | 1,807,800 | 320,000 | 39.5 |
| FY2023 Q2 | 504 | 25 | 18 | 19.6 | 872,500 | 1,053,000 | 72 |
| FY2023 Q3 | 7(a) | 189 | 59 | 129.6 | 1,808,000 | 345,500 | 31.2 |
| FY2023 Q3 | 504 | 26 | 16 | 24 | 1,662,500 | 1,297,000 | 61.5 |
| FY2023 Q4 | 7(a) | 207 | 48 | 99.6 | 1,716,750 | 345,000 | 23.2 |
| FY2023 Q4 | 504 | 23 | 3 | 3.1 | 1,050,000 | 1,876,000 | 13 |
| FY2024 Q1 | 7(a) | 188 | 37 | 62.6 | 1,276,000 | 318,700 | 19.7 |
| FY2024 Q1 | 504 | 36 | 13 | 17.8 | 1,315,000 | 1,781,000 | 36.1 |
| FY2024 Q2 | 7(a) | 190 | 32 | 52.1 | 1,448,300 | 300,000 | 16.8 |
| FY2024 Q2 | 504 | 23 | 7 | 9.3 | 1,163,000 | 1,440,000 | 30.4 |
| FY2024 Q3 | 7(a) | 226 | 33 | 64.7 | 1,803,500 | 315,850 | 14.6 |
| FY2024 Q3 | 504 | 29 | 7 | 10.3 | 1,641,000 | 1,430,000 | 24.1 |
| FY2024 Q4 | 7(a) | 253 | 37 | 94.5 | 2,230,000 | 363,500 | 14.6 |
| FY2024 Q4 | 504 | 35 | 9 | 14.8 | 1,563,000 | 1,720,000 | 25.7 |
| FY2025 Q1 | 7(a) | 242 | 34 | 55.5 | 1,512,500 | 380,000 | 14 |
| FY2025 Q1 | 504 | 27 | 10 | 26.6 | 1,942,500 | 2,015,500 | 37 |
| FY2025 Q2 | 7(a) | 263 | 34 | 63 | 1,791,000 | 371,350 | 12.9 |
| FY2025 Q2 | 504 | 35 | 10 | 21.1 | 1,858,500 | 1,855,000 | 28.6 |
| FY2025 Q3 | 7(a) | 214 | 42 | 106.9 | 2,425,500 | 350,000 | 19.6 |
| FY2025 Q3 | 504 | 27 | 12 | 21.5 | 1,738,500 | 1,745,000 | 44.4 |
| FY2025 Q4 | 7(a) | 257 | 89 | 195.9 | 1,825,000 | 425,000 | 34.6 |
| FY2025 Q4 | 504 | 35 | 19 | 36.7 | 1,634,000 | 1,655,000 | 54.3 |
| FY2026 Q1 | 7(a) | 155 | 58 | 110.1 | 1,491,600 | 350,000 | 37.4 |
| FY2026 Q1 | 504 | 16 | 10 | 14.7 | 1,284,500 | 1,771,500 | 62.5 |
| FY2026 Q2 | 7(a) | 222 | 89 | 181.6 | 1,570,000 | 386,500 | 40.1 |
| FY2026 Q2 | 504 | 37 | 20 | 33.7 | 1,553,500 | 1,612,000 | 54.1 |
| FY2026 Q3 | 7(a) | 188 | 69 | 156.3 | 1,853,000 | 445,000 | 36.7 |
| FY2026 Q3 | 504 | 22 | 13 | 22.8 | 1,591,000 | 1,606,000 | 59.1 |
How SBA c-store franchise loans compare with other industries
Summary. Gasoline stations with convenience stores draw some of the largest SBA franchise loans. From FY2020 to June 30, 2026, the industry received 2,518 franchise-coded SBA loans worth $4.48 billion, 10.2% of all franchise-coded SBA dollars. It ranked 2 of 535 industries by franchise-coded dollars, behind hotels and motels ($13.75 billion), and 3 of 73 industries with 100 or more such loans by median loan size ($1,461,150) (SBA FOIA data).
The size gap is a 7(a) story. The median franchise-coded 7(a) c-store sector loan was $1,512,750, 4.2 times the $360,000 median for all franchise-coded 7(a) loans. In 504, the c-store median ($1,054,000) was slightly below the all-franchise 504 median ($1,160,000). The median term of franchise-coded 7(a) c-store loans was 300 months, against 120 months for all franchise-coded 7(a) loans, which suggests many of these loans include real estate.
Franchise-coded 7(a) c-store loans were more often for a change of ownership (31.4%) than uncoded c-store loans (23.7%), and a similar share were startups (11.7% against 10.5%). Convenience stores without fuel rarely carry a franchise code: 4.6% of their SBA loans in the period (88 of 1,903).
How many gas stations and convenience stores are franchises (Economic Census 2007 to 2017)
Summary. On the latest Census count, about one in five U.S. gas stations and convenience stores operated as a franchise. The 2017 Economic Census counted 17,782 franchise establishments among 98,788 gasoline stations with convenience stores (NAICS 447110), a franchise share of 18.0% (Census EC1700FRAN). Convenience stores without fuel (445120) were 18.6% franchised (5,282 of 28,460) and other gasoline stations (447190) 25.2% (4,185 of 16,581).
Across all industries in the 2017 franchise tabulation, the franchise share was 11.5%, and across the tabulated retail industries 11.0%. By count, gasoline stations with convenience stores ranked 2 of 62 retail industries for franchise establishments in 2017, behind only new car dealers (21,637), and 8th among all tabulated industries. In 2007 and 2012 the industry was first in retail and second among all industries, after limited-service restaurants (Census EC1200CFRA1, EC0700CFRA1). By share, the picture is more modest: the industry ranked 25 of 247 industries with 1,000 or more establishments.
Owner type. Franchisees, not brands, owned most franchised stations in 2017: 14,745 of 17,782, or 82.9%, were franchisee-owned. In 2012 the split was close to even (54.7% franchisee-owned), with 14,871 franchisor-owned stations. The 2017 count of franchisor-owned stations, 3,037, is 79.6% lower. That drop coincides with a reworded question and lower response coverage, so it cannot be read as a real change on its own.
Trend. The franchise share of gasoline stations with convenience stores was 34.9% in 2007, 33.7% in 2012 and 18.0% in 2017. The three industries together went from 47,144 franchise establishments in 2007 to 27,249 in 2017, and from 10.4% to 5.5% of all franchise establishments in the tabulation. Read the note below before using the trend.
| Census year | Industry (NAICS 2017) | All establishments | Franchise establishments | Franchise share (%) | Franchisee-owned | Franchisor-owned | Franchisee-owned share of franchise (%) | Response coverage of the franchise question (% of sales) |
|---|---|---|---|---|---|---|---|---|
| 2007 | Gasoline stations with convenience stores (447110) | 97,508 | 33,991 | 34.9 | 17,194 | 16,797 | 50.6 | 84.6% |
| 2007 | Other gasoline stations (447190) | 21,248 | 7,257 | 34.2 | 4,811 | 2,446 | 66.3 | 83.6% |
| 2007 | Convenience stores (445120) | 25,510 | 5,896 | 23.1 | 3,249 | 2,647 | 55.1 | 66.3% |
| 2012 | Gasoline stations with convenience stores (447110) | 97,394 | 32,845 | 33.7 | 17,974 | 14,871 | 54.7 | 75.3% |
| 2012 | Other gasoline stations (447190) | 17,080 | 5,212 | 30.5 | 3,585 | 1,627 | 68.8 | 54.2% |
| 2012 | Convenience stores (445120) | 26,506 | 3,894 | 14.7 | 3,152 | 742 | 80.9 | 58.5% |
| 2017 | Gasoline stations with convenience stores (447110) | 98,788 | 17,782 | 18 | 14,745 | 3,037 | 82.9 | 50% to under 60% |
| 2017 | Other gasoline stations (447190) | 16,581 | 4,185 | 25.2 | 3,091 | 1,094 | 73.9 | 40% to under 50% |
| 2017 | Convenience stores (445120) | 28,460 | 5,282 | 18.6 | 4,063 | 1,219 | 76.9 | 30% to under 40% |
Franchise share of gas station firms, 2019 to 2023 (Annual Business Survey)
Summary. Firm-level survey data from 2019 to 2023 put gasoline stations among the most franchised U.S. industries. In 2023 (2024 ABS), 16.7% of responding gasoline station employer firms (NAICS 4571) said all or part of the business operated as a franchise, with a standard error of 1.0 points (Census ABS AB2300CSCB01). That puts gasoline stations at rank 5 of 174 4-digit industries with a published share and 2 of 21 retail industries, behind automobile dealers (31.6%). The gasoline station share is 2.0 times the retail-trade share of 8.5% and well above the 4.7% share for all sectors.
The share has held in a narrow band: 17.5% in 2019 (3-digit NAICS 447), 16.3% in 2020, 16.5% in 2021, 17.6% in 2022 and 16.7% in 2023. The ABS counts firms, not locations, and has no franchisee or franchisor split. Convenience stores without fuel cannot be isolated: from 2022 they sit inside NAICS 4451, grocery and convenience retailers, which was 8.1% franchised in 2023. The next ABS release (data year 2024) is listed for December 3, 2026 (Census upcoming releases).
Franchise vs independent convenience stores and gas stations: size per establishment, 2017
Summary. Franchise convenience stores were much larger than independent ones in 2017; franchise gas stations with convenience stores were about the same size as other stations. Receipts averaged $1,713,685 per franchise convenience store against $753,382 per non-franchise store, a ratio of 2.27, with 7.7 paid employees per franchise store against 3.8 (Census EC1700FRAN). For gasoline stations with convenience stores the ratio was 0.96: $3,687,463 per franchise station and $3,834,977 per non-franchise station, with 7.8 and 8.1 employees.
One reading, which the data cannot confirm, is that most stations sell branded fuel whatever their franchise answer, so the franchise and non-franchise groups run similar fuel-heavy formats. Receipts include fuel sales and are revenue, not profit. Non-franchise includes establishments that did not answer the question. For the cross-industry comparison of franchise and independent businesses see franchise vs independent business.
| Measure (2017) | Gas stations with c-stores: franchise | Gas stations with c-stores: non-franchise | Other gas stations: franchise | Other gas stations: non-franchise | Convenience stores: franchise | Convenience stores: non-franchise |
|---|---|---|---|---|---|---|
| Receipts per establishment ($) | 3,687,463 | 3,834,977 | 6,723,844 | 5,703,588 | 1,713,685 | 753,382 |
| Paid employees per establishment | 7.8 | 8.1 | 13.9 | 7.2 | 7.7 | 3.8 |
| Annual payroll per paid employee ($) | 20,205 | 19,744 | 22,313 | 24,778 | 19,418 | 17,324 |
| Receipts per establishment, franchise / non-franchise (ratio) | 0.96 | None | 1.18 | None | 2.27 | None |
Fuel brand franchises under the PMPA vs business-format c-store franchises
Summary. Two kinds of franchise sit under one canopy. A fuel brand agreement is a franchise under the federal Petroleum Marketing Practices Act (PMPA, 15 U.S.C. 2801 et seq.); a convenience store brand such as Circle K or APlus is a business-format franchise under the FTC Franchise Rule. SBA loan data show the fuel side dominates: 83.3% of franchise-coded SBA loans to the c-store sector from FY2015 to June 30, 2026 (3,291 of 3,949) carried a motor fuel supply or branding code, and 10.4% (410) a convenience store business-format code (SBA FOIA data).
What the PMPA covers. The PMPA defines a franchise as a contract under which a refiner or distributor lets a retailer or distributor use a refiner’s trademark in selling motor fuel, and it includes related leases of marketing premises and fuel supply contracts (15 U.S.C. 2801). A franchisor may end or not renew the relationship only on the grounds the Act lists, generally with at least 90 days’ notice; a franchisee has 1 year to sue; and the Act preempts state termination and nonrenewal rules where it applies. The FTC Franchise Rule does not apply to a relationship covered by the PMPA (16 CFR 436.8(a)(4)), so fuel brand franchisors need not issue an FTC-format disclosure document. SBA nonetheless treats PMPA-covered gas station agreements, including distributor, fuel supply, dealer and jobber agreements, as franchises for its loan procedures (SBA SOP 50 10 8.1). The franchise relationship laws tracker left the PMPA out of scope; this section fills that gap for fuel retail only.
The Directory count. SBA’s Franchise Directory file of October 9, 2026 lists 2,436 coded entries. By our name-based classification, 164 of them (6.7%) are motor fuel supply, branding or dealer agreements, mostly between jobbers and retailers for refiner brands, against 5 convenience store business-format agreements, a ratio of 32.8 to 1 (SBA Franchise Directory, Oct 9, 2026). Another 11 uncoded fuel agreements, mostly unbranded or consignment contracts, are marked as not meeting the FTC franchise definition.
Loans under convenience store business-format codes were larger at the median ($1,770,000) than loans under fuel supply codes ($1,280,000). The fuel-code share rose from 74.3% in FY2015 to FY2017 to 86.1% in FY2018 to FY2023, after SBA moved to Directory codes in 2018, which list individual jobber and distributor agreements.
| Measure | Motor fuel supply or branding agreements | Convenience store business-format agreements | All other or unclear |
|---|---|---|---|
| Coded brands in the SBA Franchise Directory (Oct 9, 2026) | 164 | 5 | 2,267 |
| Franchise-coded c-store sector loans, FY2015 to FY2026 Q3 | 3,291 | 410 | 248 |
| Share of those loans (%) | 83.3 | 10.4 | 6.3 |
| Distinct franchise codes on those loans | 558 | 24 | 105 |
| Median loan ($) | 1,280,000 | 1,770,000 | 1,135,500 |
| Loan dollars ($ billion) | 5.24 | 0.86 | 0.35 |
What 2025 to 2026 c-store and fuel franchise filings disclose
Summary. The site’s 259-FDD sample has only one c-store-type brand, so this section reads the filings directly. We pulled the latest filings of 11 convenience store, travel center and motor fuel franchise offers registered in Minnesota and issued or received from 2025 to 2026 (Minnesota CARDS). 6 are FTC-format FDDs from business-format franchisors (Circle K, Holiday, APlus and TA). 5 are Minnesota public offering statements from motor fuel franchisors (Marathon Petroleum for ARCO, Marathon, Tesoro, Exxon, Mobil and Shell; CHS for Cenex), consistent with the FTC Rule’s PMPA exemption. Every one of the filings cites the PMPA.
Units and ownership. Circle K’s store franchise FDD, issued July 10, 2026, reports 515 franchised stores against 5,556 company-owned stores at April 26, 2026. Holiday Stationstores reported 83 franchised and 455 company-owned stores at April 27, 2025. APlus is the exception, with 246 franchised and 19 company-owned outlets at the end of 2024. Circle K and Holiday run far more company-owned stores than franchised ones.
Investment. Cover-page investment ranges start at $239,850 for a leased APlus store and $317,500 for converting an existing store to a Circle K store, and run to $7,742,500 for a new Holiday Stationstore with an optional car wash and $54,060,700 for a new TA travel center. 2 of 6 business-format FDDs include an Item 19 financial performance representation; see franchise Item 19 for what that item can and cannot show, and franchise initial investment for Item 7 across sectors.
| Franchise (franchisor) | Filing type | Issue date | Initial investment on cover page | Franchised outlets (Item 20) | Company-owned outlets (Item 20) | Fiscal year end | Item 19 included | PMPA cited |
|---|---|---|---|---|---|---|---|---|
| Circle K (store franchise; fuel optional) (TMC Franchise Corporation) | FTC-format FDD | 2026-07-10 | store only: $1,462,500 to $2,864,650 new, $317,500 to $1,471,650 conversion | 515 | 5,556 | 2026-04-26 | no | Yes |
| Circle K (store and fuel, standard) (TMC Franchise Corporation) | FTC-format FDD | 2026-07-10 | $3,098,500 to $8,430,500 new, $953,500 to $3,680,500 conversion (with optional car wash) | 72 | 4,601 | 2026-04-26 | yes | Yes |
| Holiday Stationstores (Holiday Diversified Services, LLC) | FTC-format FDD | 2025-07-09 | $3,356,200 to $7,742,500 new, $896,200 to $3,252,500 conversion | 83 | 455 | 2025-04-27 | no | Yes |
| APlus (Sunoco) (Sunoco Retail LLC) | FTC-format FDD | 2025-04-24 | leased store $239,850 to $726,700; captive market non-leased $810,640 to $2,270,400 | 246 | 19 | 2024-12-31 | no | Yes |
| TA Center (travel center) (TA Franchise Systems LLC) | FTC-format FDD | 2026-03-17 | $8,084,100 to $54,060,700 new, $1,460,800 to $14,107,100 conversion | 33 | 153 | 2025-12-31 | yes | Yes |
| TA Express Center (TA Franchise Systems LLC) | FTC-format FDD | 2026-03-17 | $8,031,000 to $37,382,500 new, $1,174,000 to $9,032,000 conversion | 59 | 14 | 2025-12-31 | no | Yes |
| ARCO, Marathon and Tesoro (motor fuel) (Marathon Petroleum Company LP) | Minnesota public offering statement | 2026-04-02 | Not stated (fuel supply franchise) | None | None | None | n/a | Yes |
| Exxon and Mobil (motor fuel) (Marathon Petroleum Company LP) | Minnesota public offering statement | 2026-04-02 | Not stated (fuel supply franchise) | None | None | None | n/a | Yes |
| Shell (motor fuel) (Marathon Petroleum Company LP) | Minnesota public offering statement | 2026-04-02 | Not stated (fuel supply franchise) | None | None | None | n/a | Yes |
| Cenex Branded Petroleum Marketer (CHS Inc.) | Minnesota public offering statement | 2025-12-29 (CARDS received) | Not stated (fuel supply franchise) | None | None | None | n/a | Yes |
| Cenex Branded Petroleum Distributor (CHS Inc.) | Minnesota public offering statement | 2025-12-29 (CARDS received) | Not stated (fuel supply franchise) | None | None | None | n/a | Yes |
Where SBA c-store franchise loans go, by state
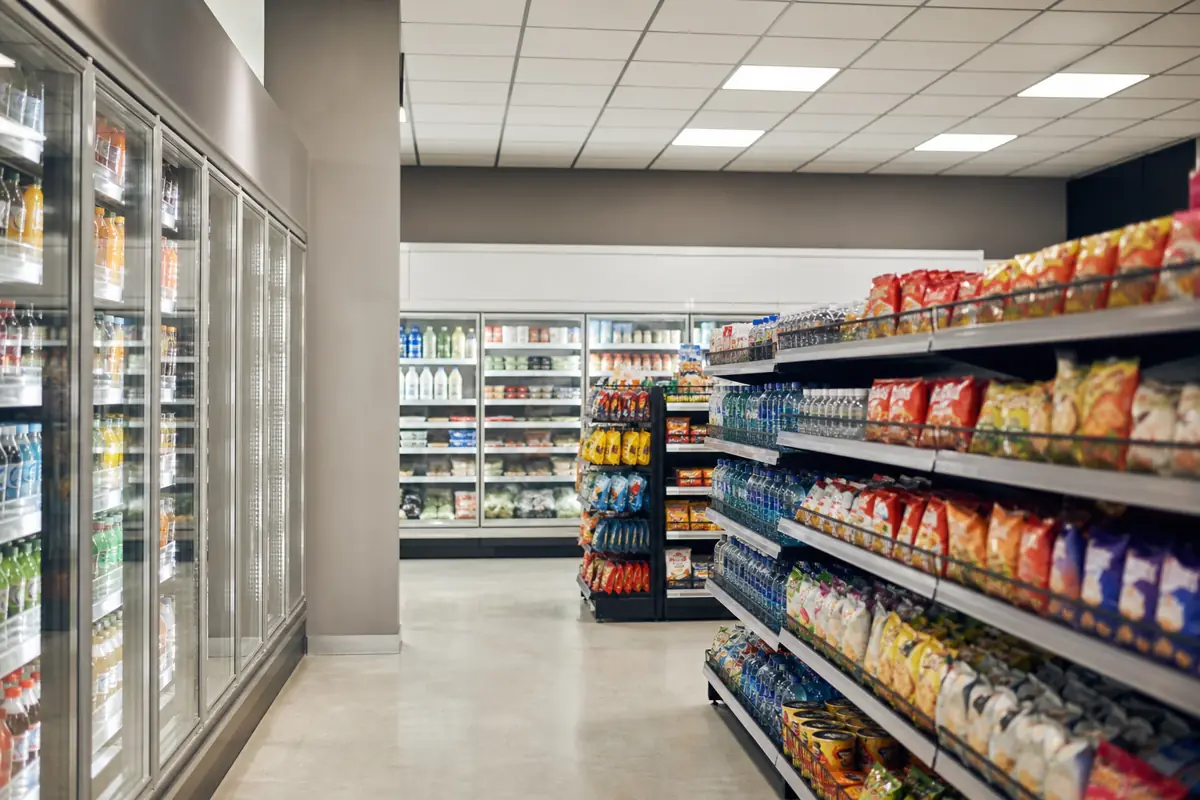
Summary. SBA franchise lending to gas stations and convenience stores is far more concentrated by state than franchise lending overall. From FY2020 to June 30, 2026, California projects received 591 franchise-coded c-store sector loans (22.4% of the U.S. total), Texas 500 (18.9%) and Washington 265 (10.0%) (SBA FOIA data). The top three states held 51.3% and the top five 65.4%, against 39.5% for the top five states in all franchise-coded lending. The concentration index (sum of squared state shares) was 1,123 for the c-store sector and 494 for all franchise lending, a ratio of 2.3.
In Washington, gas stations and convenience stores took 23.4% of all franchise-coded SBA loans, the highest share among the five states with the most such loans; in California the figure was 13.4% and in Texas 7.3%. Because most of these loans carry fuel jobber codes, state shares may partly reflect which jobbers list agreements with SBA, not only where lending happens. State totals for all franchise lending are in SBA franchise loans by state.
Original analysis: how we calculated it
1. Franchised share and owner type, 447110, 447190 and 445120 (2017)
- Formula
franchise establishments / all establishments; franchisee-owned / franchise establishments- Inputs
- D055, D075, D095, D056
- Result
- 18.0% of gasoline stations with convenience stores, 25.2% of other gasoline stations and 18.6% of convenience stores were franchises; 82.9% of franchise stations with c-stores were franchisee-owned. Ranked 2nd in retail by franchise count.
- Limitations
- 2017 wording change and 50% to 60% response coverage; 2022 not tabulated for the U.S.
2. Size per establishment, franchise vs independent (2017)
- Formula
RCPTOT x 1,000 / ESTAB and EMP / ESTAB, franchise vs all minus franchise- Inputs
- D099, D102, D059, D062
- Result
- Franchise convenience stores: $1,713,685 receipts per store vs $753,382 (ratio 2.27); franchise gas stations with c-stores: ratio 0.96.
- Limitations
- Revenue including fuel, not profit; non-franchise includes non-respondents.
3. Quarterly SBA lending and median loan vs all franchise loans
- Formula
count, sum and median of GrossApproval for franchise-coded c-store sector loans by fiscal quarter; median ratio to all franchise-coded loans- Inputs
- F132, F133, D129, D130, D450
- Result
- FY2026 Q3: 82 loans, $179.1 million, median $1,778,600 (3.7 times the all-industry franchise median). FY2020 to FY2026 Q3 median ratio 3.5; rank 2 of 535 industries by franchise-coded dollars.
- Limitations
- Directory gap (May 2023 to mid-2025) and October 2025 shutdown; quarterly 504 counts are small. Script 07_sba.py, table tbl-quarterly.
4. Fuel-brand codes vs c-store business-format codes
- Formula
rule-based classification of Directory brand names and loan franchise names; counts and shares- Inputs
- D677, D679, D682, D684, D689
- Result
- Directory: 164 fuel agreement codes vs 5 c-store business-format codes (32.8 to 1). Loans: 83.3% fuel codes, 10.4% c-store codes.
- Limitations
- Name-based; a few codes are unclear. Script 08_codes.py, review lists in scripts/out/.
5. State concentration of SBA c-store franchise loans
- Formula
state share of U.S. franchise-coded c-store loans; sum of squared shares (HHI) vs all franchise-coded loans- Inputs
- D671, D672, D673, D674, D675
- Result
- Top 3 states 51.3%, top 5 65.4% (all franchise lending: 39.5%); HHI 1,123 vs 494 (2.3 times).
- Limitations
- Project state; reflects lender and jobber coding as well as lending. FY2020 to FY2026 Q3 pooled.
What to watch next quarter
- SBA FY2026 Q4 file. SBA posts FOIA files about one month after quarter end; the file covering July to September 2026 is next (SBA FOIA data). FY2026 Q4 will be the first full year-on-year comparison with both quarters after the Directory came back.
- SOP 50 10 8.1. Effective October 1, 2026, it requires a Phase I environmental review for NAICS 457 gas station loans and the PMPA treatment of fuel agreements (SOP 50 10 8.1); watch whether loan sizes or the fuel-code share shift after it.
- 2024 ABS. Census lists the 2024 ABS for December 3, 2026; it will update the gasoline station franchise share of firms.
- Directory files. SBA reissues the Directory file (this report uses the October 9, 2026 file); later files will show whether the count of fuel agreement codes keeps changing.
- FDD renewals. Holiday and APlus filings in this slice date from 2025; their 2026 clean filings will update Item 20 counts.
Where the data stops
- Old establishment counts. The 2017 Economic Census is the latest U.S. franchise tabulation, and its question wording and response coverage differ from 2007 and 2012.
- Branded fuel is ambiguous in Census data. A station selling a refiner’s brand under a PMPA agreement may or may not answer yes to the franchise question; Census does not split fuel brand franchises from store franchises.
- SBA franchise codes are lender-entered. They depend on the Directory; the gap from May 2023 to mid-2025 understates coded loans. SBA loans are a slice of financing, not a census of stations.
- Code classification is name-based. We classed codes by their agreement names; the largest unclear code (66 loans) is a distributor product sales agreement that does not name the product.
- Industry counts differ. NACS counts 151,975 convenience stores at December 31, 2025, of which 122,620 sell fuel (NACS); County Business Patterns counts 96,002 gasoline stations with convenience stores and 36,992 convenience stores in 2023 (Census CBP 2023). Definitions differ; none has a franchise flag.
- FDD slice. Minnesota registrations only, read by hand; not every c-store franchisor registers in Minnesota.
Signals to watch
- 18.0% of U.S. gasoline stations with convenience stores (17,782 of 98,788) were franchise establishments in 2017, the latest Census count. Census EC1700FRAN
- 18.6% of U.S. convenience stores without fuel (5,282 of 28,460) were franchises in 2017. Census EC1700FRAN
- 82.9% of franchise gasoline stations with convenience stores were franchisee-owned in 2017, up from 54.7% in 2012 (U.S.). Census EC1700FRAN, EC1200CFRA1
- Gasoline stations with convenience stores had the 2nd-largest count of franchise establishments among 62 U.S. retail industries in 2017, after new car dealers. Census EC1700FRAN
- 16.7% of responding U.S. gasoline station employer firms operated all or part as a franchise in 2023 (2024 ABS), against 8.5% for retail. Census ABS AB2300CSCB01
- Lenders approved 82 franchise-coded SBA 7(a) and 504 loans to U.S. gas stations and convenience stores in FY2026 Q3 (April to June 2026), worth $179.1 million. SBA FOIA, as of 2026-06-30
- The median franchise-coded SBA loan to the U.S. c-store sector was $1,778,600 in FY2026 Q3, against $486,500 for all franchise-coded loans. SBA FOIA
- From FY2020 to June 30, 2026, U.S. gasoline stations with convenience stores received $4.48 billion in franchise-coded SBA loans, 10.2% of all franchise-coded SBA dollars and 2nd among all industries. SBA FOIA
- 83.3% of franchise-coded SBA loans to U.S. gas stations and convenience stores from FY2015 to June 2026 used a motor fuel supply or branding code; 10.4% used a convenience store business-format code. SBA FOIA; site classification
- SBA’s Franchise Directory of October 9, 2026 lists 164 fuel supply and branding agreement codes against 5 convenience store business-format codes. SBA Franchise Directory
- The franchise-coded share of U.S. c-store sector SBA loans fell from 49.3% (October 2021 to May 2023) to 17.4% (October 2023 to February 2025) while the Directory was withdrawn, then recovered to 39.2%. SBA FOIA
- California (22.4%), Texas (18.9%) and Washington (10.0%) held 51.3% of U.S. franchise-coded SBA c-store loans from FY2020 to June 2026. SBA FOIA
- Franchise convenience stores averaged $1,713,685 in receipts in 2017 against $753,382 for non-franchise U.S. stores. Census EC1700FRAN
- Circle K’s July 2026 FDD reports 515 franchised U.S. stores and 5,556 company-owned stores at April 26, 2026. Circle K FDD via Minnesota CARDS
Questions people ask
How many gas stations are franchises?
The 2017 Economic Census, the latest U.S. count, found 17,782 franchise gasoline stations with convenience stores (18.0% of 98,788) and 4,185 franchise gasoline stations without them (25.2%) (Census EC1700FRAN). By firms, 16.7% of responding gasoline station employer firms (3,557 firms) operated all or part as a franchise in 2023 (2024 ABS). Stations selling a refiner’s fuel brand under a PMPA agreement may or may not answer yes to the Census question, so these counts may not capture every branded station.
How much does a convenience store franchise cost?
In filings from 2025 to 2026, cover-page investment ranges ran from $239,850 to $726,700 for a leased APlus store, from $317,500 to $1,471,650 to convert an existing store to a Circle K store (store only), and from $3,356,200 to $7,742,500 for a new Holiday Stationstore with an optional car wash (Minnesota CARDS filings). Land, new construction and fuel equipment drive the high end. These are franchisor estimates, not quotes; see franchise costs for how to read Item 7.
Is a branded gas station a franchise?
Under federal law, usually yes for the fuel side. The PMPA defines a franchise as a contract under which a refiner or distributor lets a retailer use a refiner’s trademark to sell motor fuel, including related premises leases and supply contracts (15 U.S.C. 2801). Those relationships are exempt from the FTC Franchise Rule’s disclosure duty (16 CFR 436.8(a)(4)), but SBA treats them as franchises for lending (SOP 50 10 8.1). 83.3% of franchise-coded SBA c-store loans from FY2015 to June 2026 used fuel supply codes. This is general information, not legal advice.
What is the PMPA?
The Petroleum Marketing Practices Act (15 U.S.C. 2801 et seq.) is the federal law that governs motor fuel franchises between refiners, distributors and retailers. It limits when a franchisor can end or not renew a fuel franchise, requires at least 90 days’ notice in most cases, gives franchisees 1 year to sue, and preempts state termination rules where it applies (U.S. Code). General franchise relationship laws, tracked in franchise relationship laws, do not cover it.
Can you get an SBA loan for a gas station?
Yes. From FY2020 to June 30, 2026, SBA guaranteed 4,854 7(a) and 504 loans to gasoline stations with convenience stores, 2,518 of them franchise-coded with a median of $1,461,150 (SBA FOIA data). SBA requires the environmental review for NAICS 457 gas station loans to start with a Phase I site assessment and follow its gas station appendix (SOP 50 10 8.1). Program-wide rules are covered in SBA franchise loans.
Frequently asked questions
What percentage of convenience stores are franchises?
18.6% of U.S. convenience stores without fuel and 18.0% of gasoline stations with convenience stores were franchise establishments in the 2017 Economic Census, the latest U.S. count (Census).
Are franchised gas stations owned by franchisees or by the brands?
Mostly franchisees: 82.9% of franchise gasoline stations with convenience stores were franchisee-owned in 2017, against 54.7% in 2012 (Census). The 2017 question was reworded, so part of the shift may be measurement.
Why did the franchise share of gas stations fall between 2012 and 2017?
The share fell from 33.7% to 18.0%, but Census reworded the question for 2017 and response coverage dropped to the 50% to 60% band (CES-WP-19-20). The data cannot separate a real change from a measurement change.
Is there a newer Census franchise count than 2017?
No. The 2022 Economic Census schedule lists no U.S. franchise table (Census). The Annual Business Survey gives firm-level shares to 2023; the 2024 ABS is listed for December 3, 2026.
How big are SBA loans to franchised gas stations and convenience stores?
The median franchise-coded SBA loan to the sector was $1,432,000 from FY2020 to June 30, 2026, 3.5 times the $407,000 median for all franchise-coded loans (SBA FOIA data).
Which states get the most SBA franchise loans for convenience stores?
California (591 loans), Texas (500) and Washington (265) led from FY2020 to June 30, 2026, together 51.3% of the U.S. total (SBA FOIA data).
Why did SBA franchise loans to gas stations drop in 2024?
Mostly coding. SBA stopped publishing its Franchise Directory on May 11, 2023, and the franchise-coded share of c-store sector loans fell to 17.4% from October 2023 to February 2025 before recovering to 39.2% after June 2025 (SBA FOIA data).
Do convenience store franchise FDDs disclose earnings?
Some do. 2 of 6 business-format FDDs in our 2025 to 2026 slice include an Item 19 financial performance representation (Minnesota CARDS). Read Item 19 itself; this report does not use its figures.
How many convenience stores are there in the U.S.?
NACS counts 151,975 convenience stores at December 31, 2025, 122,620 of them selling fuel (NACS). County Business Patterns counts 96,002 gasoline stations with convenience stores and 36,992 convenience stores in 2023 (Census CBP); definitions differ.
Does the PMPA apply to a convenience store franchise without fuel?
The PMPA’s franchise definition is tied to the use of a refiner’s trademark in selling motor fuel (15 U.S.C. 2801), so a store-only agreement does not fit it on its face; it falls under the FTC Franchise Rule and state franchise laws instead. Ask counsel about any specific contract.
For journalists
Most quotable statistics
18.0% of U.S. gasoline stations with convenience stores were franchises in 2017, the latest Census count.
U.S. Census Bureau, EC1700FRANSBA lenders approved 82 franchise-coded loans to U.S. gas stations and convenience stores in April to June 2026, worth $179.1 million.
SBA 7(a)/504 FOIA83.3% of franchise-coded SBA loans to U.S. gas stations and convenience stores from FY2015 to June 2026 carried fuel brand or supply codes, not store franchise codes.
SBA FOIA; Franchise Consultants and Brokers classificationU.S. gas stations with convenience stores drew $4.48 billion in franchise-coded SBA loans from FY2020 to June 2026, second only to hotels.
SBA 7(a)/504 FOIA16.7% of responding U.S. gasoline station firms operated as franchises in 2023, twice the retail share of 8.5%.
U.S. Census Bureau, 2024 ABSSBA’s Franchise Directory (October 9, 2026) lists 164 fuel agreement codes against 5 convenience store franchise codes.
SBA Franchise Directory
If you cite only a few, cite these
- 18.0% of U.S. gas stations with convenience stores were franchises in 2017 (Census EC1700FRAN). source
- 82 franchise-coded SBA loans to U.S. gas stations and c-stores in FY2026 Q3, $179.1 million (SBA FOIA). source
- 83.3% of franchise-coded SBA c-store loans used fuel supply or branding codes, FY2015 to June 2026 (SBA FOIA). source
Press summary and suggested headlines
Gas stations and convenience stores are among the most franchised U.S. retail formats, but much of that franchising is fuel branding rather than store franchising. The 2017 Economic Census, still the latest U.S. count, found 18.0% of gasoline stations with convenience stores were franchises, the second-largest franchise count in retail. In 2023, 16.7% of responding gasoline station firms said they operated as franchises, twice the retail share. SBA loan files show that 83.3% of franchise-coded loans to the sector since FY2015 carried a fuel supply or branding code governed by the federal Petroleum Marketing Practices Act, and SBA's current Franchise Directory lists 164 fuel agreement codes against 5 store codes. The loans are large: gas stations with convenience stores drew $4.48 billion from FY2020 to June 2026, second only to hotels. In April to June 2026, lenders approved 82 franchise-coded loans worth $179.1 million, up from 54 a year earlier, partly because franchise coding recovered.
Suggested headlines
- Most SBA 'franchise' loans to gas stations are fuel brand deals: 83.3% of the total
- Gas stations take $4.48 billion in SBA franchise loans, second only to hotels
- 18.0% of U.S. gas stations with convenience stores are franchises, latest Census count shows
- SBA franchise loans to gas stations and c-stores reach 82 in spring 2026 as coding recovers
- California, Texas and Washington hold 51.3% of SBA franchise loans to convenience stores
Methodology
Question and scope. How franchised U.S. gas stations and convenience stores are, how much of fuel retail runs under PMPA motor fuel franchises, how franchise locations compare with independents, and how much SBA lending goes to franchised c-stores each quarter. Industries: NAICS 447110 gasoline stations with convenience stores, 447190 other gasoline stations and 445120 convenience stores (NAICS 2017; 457110, 457120 and 445131 in NAICS 2022).
Sources and selection. Primary federal data first: the Economic Census franchise status files for 2007, 2012 and 2017 (Census EC1700FRAN), the Annual Business Survey franchise question for data years 2019 to 2023 (ABS), SBA 7(a) and 504 FOIA loan files as of June 30, 2026 (SBA FOIA), SBA’s Franchise Directory file of October 9, 2026, the PMPA text (GovInfo), the FTC Rule (eCFR) and SBA SOP 50 10 8.1. Franchise filings come from Minnesota CARDS (CARDS). NACS store counts are industry figures (Tier 2). A law-firm bulletin (Tier 3) is used only for the Directory’s 2018 creation and 2025 return.
Definitions. Franchise-coded SBA loan = a loan with a lender-entered SBA franchise identifier. C-store sector = the three NAICS industries above, with 2017 and 2022 codes merged. Quarters are federal fiscal quarters (Q1 = October to December). Census non-franchise = all establishments minus franchise establishments, which includes non-respondents.
Classification of codes. Directory brand names and loan franchise names were classed by rules (scripts/08_codes.py) as motor fuel supply or branding agreements, convenience store business-format agreements, or other; the classed lists were reviewed by hand and are saved with the scripts.
Conflicts and comparability. Census establishments (2017), ABS firms (2023), SBA loans (FY2015 to June 2026) and NACS stores (December 2025) measure different things in different years and are never added together. The 2017 Census change in question wording and coverage is flagged wherever 2017 is compared with 2007 or 2012. SBA coded counts from May 2023 to mid-2025 are flagged as depressed by the Directory gap.
Derived metrics. Shares, medians, ratios, ranks and concentration indexes are computed by the scripts in scripts/ from the raw files and listed with formulas in derived.csv; every number in this report is a row in factsheet.csv. Borrower names and addresses were never loaded from SBA files. No brand-level loan outcomes are reported.
Update schedule. Quarterly, after each SBA FOIA release (about one month after quarter end); Census and ABS sections when new releases appear. Last updated 2026-10-14. This report is not legal, tax or investment advice.
Sources and source quality
Tier 1: primary and government sources (41)
- 2017 Economic Census, Franchise Status for the U.S. and States (EC1700FRAN), bulk file, U.S. Census Bureau (accessed 2026-10-14)
- 2012 Economic Census, Franchise Status (EC1200CFRA1), bulk file, U.S. Census Bureau (accessed 2026-10-14)
- 2007 Economic Census, Franchise Status (EC0700CFRA1), bulk file, U.S. Census Bureau (accessed 2026-10-14)
- 2017 Economic Census data dictionary (symbols and data-quality flags), U.S. Census Bureau (accessed 2026-10-14)
- 2022 Economic Census data release schedule, U.S. Census Bureau (accessed 2026-10-14)
- Staudt and Wei, Automating Response Evaluation for Franchising Questions on the 2017 Economic Census (CES-WP-19-20), U.S. Census Bureau, Center for Economic Studies (accessed 2026-10-14)
- Annual Business Survey, reference year 2019 (2020 ABS), company summary AB1900CSCB01, U.S. Census Bureau (accessed 2026-10-14)
- Annual Business Survey, reference year 2020 (2021 ABS), company summary AB2000CSCB01, U.S. Census Bureau (accessed 2026-10-14)
- Annual Business Survey, reference year 2021 (2022 ABS), company summary AB2100CSCB01, U.S. Census Bureau (accessed 2026-10-14)
- Annual Business Survey, reference year 2022 (2023 ABS), company summary AB2200CSCB01, U.S. Census Bureau (accessed 2026-10-14)
- Annual Business Survey, reference year 2023 (2024 ABS), company summary AB2300CSCB01, U.S. Census Bureau (accessed 2026-10-14)
- Census Bureau upcoming data releases, U.S. Census Bureau (accessed 2026-10-14)
- County Business Patterns 2023, U.S. file (cbp23us), U.S. Census Bureau (accessed 2026-10-14)
- 2017 to 2022 NAICS concordance, U.S. Census Bureau (accessed 2026-10-14)
- QCEW open data, 2025 annual averages, NAICS 457110, U.S. Bureau of Labor Statistics (accessed 2026-10-14)
- QCEW open data, 2025 annual averages, NAICS 457120, U.S. Bureau of Labor Statistics (accessed 2026-10-14)
- QCEW open data, 2025 annual averages, NAICS 445131, U.S. Bureau of Labor Statistics (accessed 2026-10-14)
- QCEW open data, 2015 annual averages, NAICS 447110, U.S. Bureau of Labor Statistics (accessed 2026-10-14)
- QCEW open data, 2015 annual averages, NAICS 447190, U.S. Bureau of Labor Statistics (accessed 2026-10-14)
- QCEW open data, 2015 annual averages, NAICS 445120, U.S. Bureau of Labor Statistics (accessed 2026-10-14)
- 7(a) and 504 FOIA loan-level files and data dictionary, as of June 30, 2026, U.S. Small Business Administration (accessed 2026-10-14)
- SBA Franchise Directory file, October 9, 2026 (xlsx), U.S. Small Business Administration (accessed 2026-10-14)
- Affiliation and Lending Criteria for the SBA Business Loan Programs, final rule, 88 FR 21074 (April 10, 2023), Federal Register (GovInfo) (accessed 2026-10-14)
- SOP 50 10 8.1, Lender and Development Company Loan Programs, with technical policy updates effective October 1, 2026 (docx), U.S. Small Business Administration (accessed 2026-10-14)
- SOP 50 10 Lender and Development Company Loan Programs (version history page), U.S. Small Business Administration (accessed 2026-10-14)
- Shutdown Blocks SBA from Delivering $5 Billion to Small Businesses (news release, November 13, 2025), U.S. Small Business Administration (accessed 2026-10-14)
- 15 U.S.C. chapter 55, subchapter I (Petroleum Marketing Practices Act, franchise protection), 2024 edition, GovInfo (U.S. Code) (accessed 2026-10-14)
- 16 CFR 436.8, Exemptions (FTC Franchise Rule), eCFR (accessed 2026-10-14)
- Minnesota CARDS franchise registrations search, Minnesota Department of Commerce (accessed 2026-10-14)
- FDD fee dataset (Items 5, 6, 19, 20), 259 Minnesota-registered FDDs, Franchise Consultants and Brokers (from Minnesota CARDS filings) (accessed 2026-10-14)
- Circle K FDD (store franchise), issued July 10, 2026, TMC Franchise Corporation via Minnesota CARDS (accessed 2026-10-14)
- Circle K FDD (store and motor fuel, standard), issued July 10, 2026, TMC Franchise Corporation via Minnesota CARDS (accessed 2026-10-14)
- Holiday Stationstores FDD, issued July 9, 2025, Holiday Diversified Services, LLC via Minnesota CARDS (accessed 2026-10-14)
- APlus FDD, issued April 24, 2025 (filed October 2025), Sunoco Retail LLC via Minnesota CARDS (accessed 2026-10-14)
- TA Center FDD, issued March 17, 2026, amended September 1, 2026, TA Franchise Systems LLC via Minnesota CARDS (accessed 2026-10-14)
- TA Express Center FDD, issued March 17, 2026, amended September 1, 2026, TA Franchise Systems LLC via Minnesota CARDS (accessed 2026-10-14)
- Minnesota public offering statement, ARCO, Marathon and Tesoro, issued April 2, 2026, Marathon Petroleum Company LP via Minnesota CARDS (accessed 2026-10-14)
- Minnesota public offering statement, Exxon and Mobil, issued April 2, 2026, Marathon Petroleum Company LP via Minnesota CARDS (accessed 2026-10-14)
- Minnesota public offering statement, Shell, issued April 2, 2026, Marathon Petroleum Company LP via Minnesota CARDS (accessed 2026-10-14)
- Minnesota public offering statement, Cenex Branded Petroleum Marketer (received December 29, 2025), CHS Inc. via Minnesota CARDS (accessed 2026-10-14)
- Minnesota public offering statement, Cenex Branded Petroleum Distributor (received December 29, 2025), CHS Inc. via Minnesota CARDS (accessed 2026-10-14)
Tier 2: trade bodies, market research, company filings (1)
- U.S. Convenience Store Count (2026 NACS/NIQ TDLinx count, as of December 31, 2025), NACS (accessed 2026-10-14)
Tier 3: journalism and commentary (1)
- SBA Franchise Directory Reintroduced Effective June 1, 2025 (law bulletin, April 23, 2025), Taft Stettinius & Hollister LLP (accessed 2026-10-14)
Related research
Automotive Franchise Statistics
100% of US new car dealer establishments franchised, 2017
Read the research
Education Franchise Statistics
37.1% of US exam preparation and tutoring establishments were franchised in 2017 (rank 10 of 267 industries)
Read the research
Restaurant Franchise Statistics
57.3% of U.S. limited-service restaurant establishments were franchises (2017)
Read the research
SBA Franchise Loans by State
2.09: Franchise 7(a) loans per 100,000 residents per year, US, Oct 2021 to Apr 2023 and FY2026 through June 30, 2026
Read the researchHow to cite and reuse
Franchise Consultants and Brokers Editorial Team. "Convenience Store Franchise Statistics: Gas Stations, Fuel Brands and SBA Loans." Franchise Consultants and Brokers, updated October 14, 2026. https://franchiseconsultantsandbrokers.com/research/convenience-store-franchise-statistics/
The data tables and charts on this page are licensed under CC BY 4.0. Please credit “Franchise Consultants and Brokers, franchiseconsultantsandbrokers.com” with a link to this page.
Download the data
- Latest-quarter readout, FY2026 Q3 vs FY2025 Q3 (CSV)
- SBA c-store sector loans by fiscal quarter, FY2015 Q1 to FY2026 Q3 (CSV)
- Census franchise status of gas stations and convenience stores, 2007 to 2017 (CSV)
- Size per establishment by franchise status, 2017 (CSV)
- Fuel-brand vs c-store business-format codes (CSV)
- C-store and fuel franchise filings, 2025 to 2026 (CSV)
- SBA c-store franchise loans by state, FY2020 to FY2026 Q3 (CSV)
- Top 10 industries by franchise-coded SBA dollars (CSV)
- ABS franchise share of gasoline station firms, 2019 to 2023 (CSV)
- Full fact sheet with sources (CSV)