Car Rental Franchise Statistics: Who Owns the Locations, What Licensees Pay
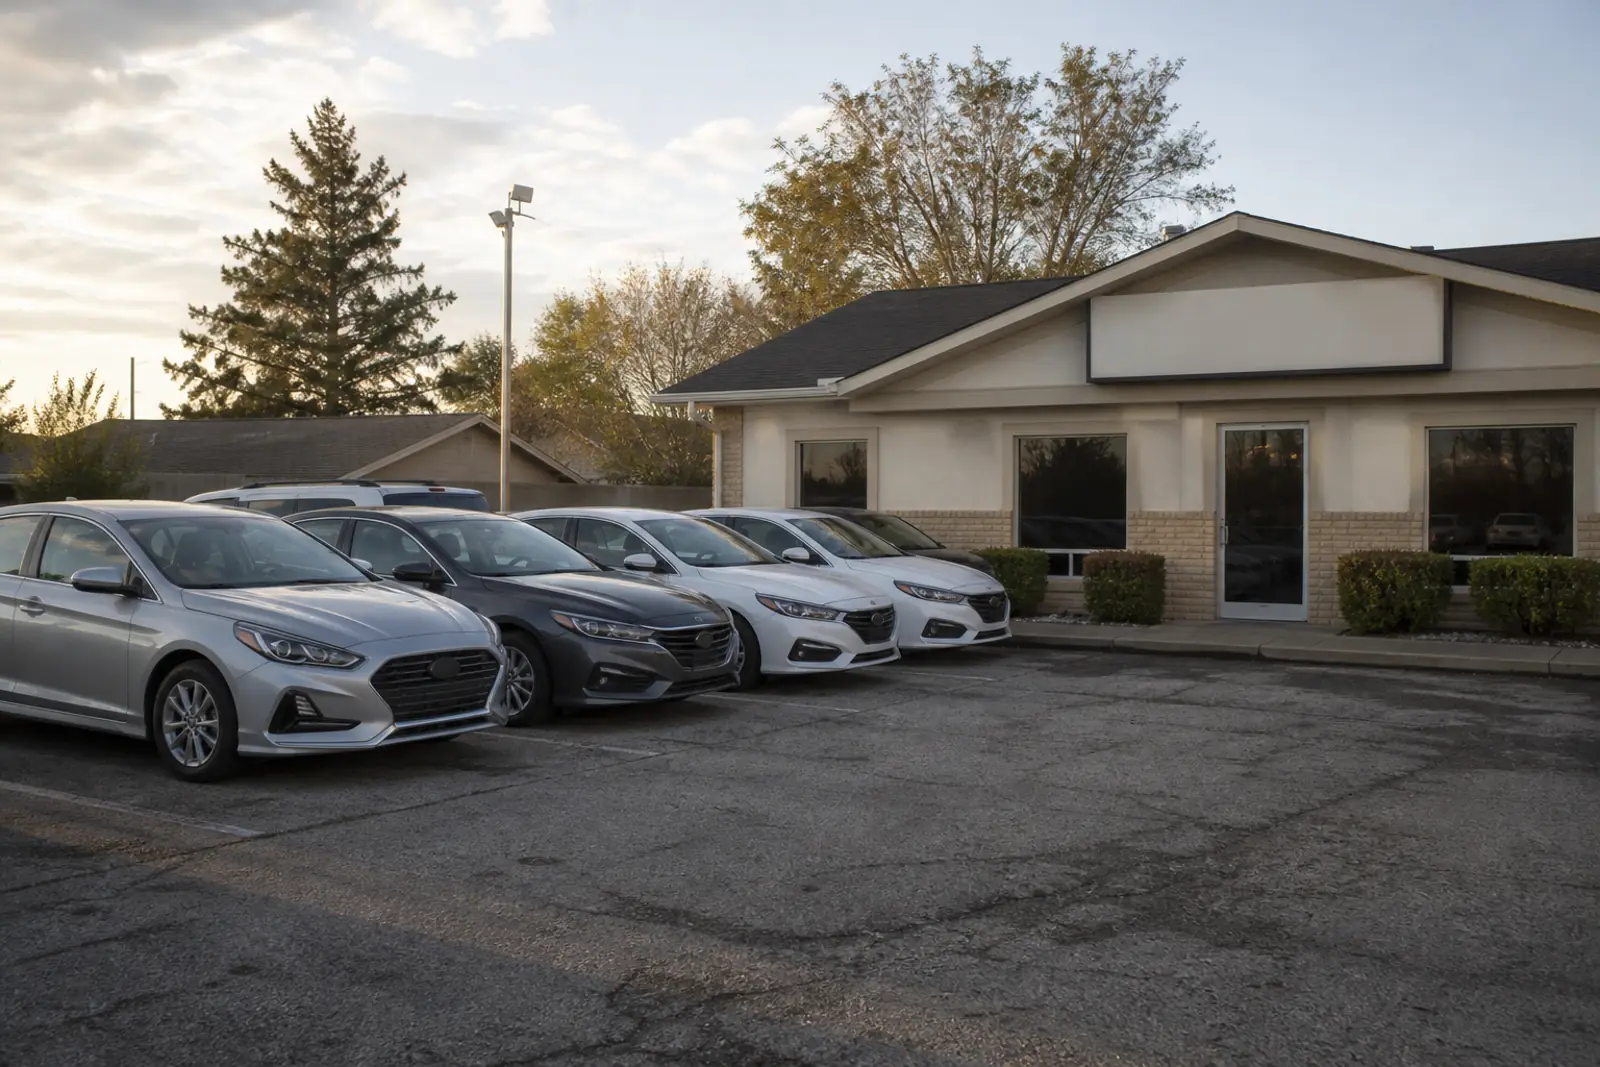
Car rental franchise locations are mostly company-run, not franchisee-owned. In the 2017 Economic Census, 32.2% of 12,209 U.S. car rental establishments belonged to franchise systems, but only 4.4% were franchisee-owned. Avis and Budget FDDs show 10.7% of U.S. outlets franchised in 2023, and licensee royalties were 1.29% of Avis Budget revenue in FY2025.
Abstract
- Car rental is branded but not franchisee-owned: in 2017, 3,935 of 12,209 U.S. passenger car rental establishments (32.2%) were in a franchise system, but 3,400 of those were franchisor-owned and only 535 were franchisee-owned (U.S. Census Bureau, 2017 Economic Census).
- The working hypothesis held outside the United States and failed inside it. Avis Budget licensees ran 38.0% of the group’s worldwide locations in FY2025 and 62.2% of Avis and Budget international locations, but 22.7% in the Americas and 10.7% of U.S. Avis and Budget outlets in the 2024 FDDs.
- Licensees earn the brands little revenue: licensee royalties were $150 million, or 1.29% of Avis Budget’s $11,652 million FY2025 revenue; Hertz says franchisee fees were about 2% of its worldwide vehicle rental revenues.
- Franchisee-owned car rental locations were not smaller than company-run franchise locations in 2017: receipts per establishment were $1,930,183 vs $1,940,611, and franchisee-owned sites had 10.9 paid employees each vs 4.9.
- SBA lending barely reaches the sector’s franchises: 17 7(a) and 504 loans in FY2011 to FY2026 carried a vehicle-rental brand code, about 1.1 a year, and only 3.6% of 7(a) car rental loans were franchise-coded against 10.1% for all 7(a) loans.
- Car rental FDDs price territory and fleet, not just a percentage: initial fees run from $25,000 for a single neighborhood point to $800,000 for the top airport tier, royalties are 4% to 6% of gross revenue, and vehicles make up 78.5% to 86.8% of the high-end Item 7 estimate in four of six car rental FDDs.
- Truck rental runs on commissioned dealers instead: U-Haul lists over 23,000 independent dealers next to over 2,400 company stores (FY ended March 31, 2026), and the Census put franchisee-owned truck, trailer and RV rental establishments at 2.6% in 2017.
What's new
- Latest 10-K filings used: Avis Budget Group FY2025 (filed 2026-02-19), Hertz Global FY2025 (filed 2026-02-26) and U-Haul Holding FY ended March 31, 2026 (filed 2026-05-27).
- Latest SBA FOIA file: 7(a) and 504 loans as of 2026-06-30; SBA says files typically post about one month after quarter end, so a September 30, 2026 file is the next update.
- FDD dates: PacLease effective 2026-02-18; Priceless and NextCar issued 2025-10-06; Green Motion and U-Save issued 2025-05-27. The newest Avis and Budget FDDs that could be downloaded from the California DFPI site are dated 2024-04-29; Budget’s 2026 application timed out.
- The 2017 Economic Census remains the latest U.S. franchise tabulation: the 2022 release list carries a franchise table for Puerto Rico only (IA2200SUBJ09).
- The Census upcoming-releases page lists an Annual Business Survey release for 2026-12-03; the latest franchise rows used here are for data year 2023 (2024 ABS).
Key findings
- In 2017, 3,935 of 12,209 U.S. passenger car rental establishments (32.2%) operated in a franchise system, ranking 11 of 241 industries with 1,000 or more establishments (median 3.3%). U.S. Census Bureau, 2017 Economic Census
- Only 535 U.S. car rental establishments (4.4%) were franchisee-owned in 2017; 3,400 (86.4% of franchise establishments) were franchisor-owned, against 82.6% franchisee-owned across all industries. U.S. Census Bureau, 2017 Economic Census
- Franchisee-owned car rental establishments had 3.5% of U.S. industry receipts in 2017; all franchise-system establishments had 25.6%. U.S. Census Bureau, 2017 Economic Census
- The Census owner split is unstable: franchisee-owned establishments were 35.3% of U.S. car rental establishments in 2007, 8.3% in 2012 and 4.4% in 2017, while response coverage rose from 47.6% (2007) to 71.4% (2012). U.S. Census Bureau, Economic Census 2007, 2012, 2017
- Avis Budget Group reported about 3,800 licensee-operated locations out of about 10,000 worldwide at the end of FY2025 (38.0%), up from 36.1% in FY2023. Avis Budget Group Form 10-K, FY2023 and FY2025
- Avis Budget licensee royalty revenue was $150 million in FY2025, 1.29% of $11,652 million total revenues; $110 million of it came from the International segment. Avis Budget Group Form 10-K, FY2025
- Licensees ran 62.2% of Avis and Budget international car rental locations in FY2025 but 22.7% of those in the Americas. Avis Budget Group Form 10-K, FY2025
- In the April 2024 FDDs, Avis listed 169 franchised and 1,691 company-owned U.S. outlets at the end of 2023, and Budget listed 177 and 1,197: 10.7% franchised combined. Avis and Budget FDDs issued 2024-04-29 (California DFPI)
- Hertz states that franchisee fees made up about 2% of its worldwide vehicle rental revenues in FY2025, the same share it stated for FY2023 and FY2024. Hertz Global Holdings Form 10-K, FY2025
- Hertz’s Americas network had about 4,600 company-operated and franchisee locations at the end of 2025, 56.5% of them off airport, down from 63.5% in 2023. Hertz Global Holdings Form 10-K, FY2023 and FY2025
- SBA approved 392 7(a) loans to U.S. passenger car rental businesses from FY2010 to June 30, 2026 ($105.9 million); 14 (3.6%) carried a franchise code, with a median of $430,000 vs $50,000 for the rest. SBA 7(a) FOIA data as of 2026-06-30
- Car rental FDDs tie airport fees to traffic: Priceless charges $25,000 for a single point location and $30,000 to $125,000 at airports, 5.0 times the single point fee at the top tier (FDD issued October 6, 2025). Priceless Car & Truck Rental FDD, Minnesota CARDS
- Vehicles are 86.8% of Priceless’s high Item 7 estimate of $2,592,533 and 82.2% of the Avis and Budget estimate of $1,568,400 for a 30-car fleet. Priceless FDD (2025-10-06); Avis and Budget FDDs (2024-04-29)
- U-Haul lists over 23,000 independent dealers and over 2,400 company-operated stores (FY ended March 31, 2026); dealers act as rental agents paid a commission on gross rental revenue. U-Haul Holding Company Form 10-K, FY2026
Car rental franchise share by measure: branded, licensed, franchisee-owned
The answer depends on what is counted. A car rental location can carry a franchise brand and still be run by the brand owner, so a count of branded locations and a count of franchisee-owned locations give very different numbers.
The widest measure comes from the U.S. Census Bureau, 2017 Economic Census: 32.2% of U.S. passenger car rental establishments (NAICS 532111) were in a franchise system in 2017. The narrowest is ownership. Only 4.4% of establishments were franchisee-owned in the same census.
Company filings sit in between. Licensees ran 38.0% of Avis Budget Group locations worldwide at the end of FY2025 (Avis Budget Group FY2025 10-K), but the Avis and Budget FDDs list 10.7% of U.S. outlets as franchised at the end of 2023 (Avis FDD, Budget FDD). Among employer firms in automotive equipment rental and leasing (NAICS 5321), 13.1% said they operated as a franchise in 2023 (Annual Business Survey), with a standard error of 5.4 points.
Definitions. A franchisee-owned establishment is run by an independent operator under a brand license. A franchisor-owned establishment is a company-operated location of a franchise system. Avis Budget calls its franchisees licensees; Hertz uses franchisees.
Franchisee-owned vs company-operated car rental locations, 2007 to 2017
In the latest U.S. tabulation, franchise car rental mostly means company-operated locations of branded systems. Of 3,935 franchise establishments in 2017, 3,400 (86.4%) were franchisor-owned (U.S. Census Bureau, 2017 Economic Census). Across all industries with a published owner split, 82.6% of franchise establishments were franchisee-owned.
Earlier censuses show a different mix. In 2007, 2,228 of 2,502 car rental franchise establishments were franchisee-owned (2007 Economic Census); in 2012 the figure was 824 of 1,209 (2012 Economic Census). Total establishments also rose from 6,309 to 12,209.
These swings are too large to read as a trend. Franchise status is self-reported, and the share of sales from establishments that answered the franchise question was 47.6% in 2007 and 71.4% in 2012; the 2017 file publishes only a coded band. A change in how a few large multi-location companies answered would move the split by thousands of locations. The 2017 snapshot is the best available. The 2022 Economic Census has no U.S. franchise table (Census 2022 release list).
| Industry (NAICS) | Year | Establishments | Franchise establishments | Franchisee-owned | Franchisor-owned | Franchise share of establishments (%) | Franchisee-owned share (%) | Franchise share of receipts (%) | Franchise question coverage (% of sales) |
|---|---|---|---|---|---|---|---|---|---|
| Passenger car rental (532111) | 2,007 | 6,309 | 2,502 | 2,228 | 274 | 39.7 | 35.3 | 9.2 | 47.6 |
| Passenger car rental (532111) | 2,012 | 9,948 | 1,209 | 824 | 385 | 12.2 | 8.3 | 11.6 | 71.4 |
| Passenger car rental (532111) | 2,017 | 12,209 | 3,935 | 535 | 3,400 | 32.2 | 4.4 | 25.6 | Coded band only |
| Truck, trailer and RV rental (532120) | 2,007 | 6,301 | 245 | 217 | 28 | 3.9 | 3.4 | 2.2 | 76.7 |
| Truck, trailer and RV rental (532120) | 2,012 | 5,724 | 287 | 259 | 28 | 5 | 4.5 | 4.6 | 52.6 |
| Truck, trailer and RV rental (532120) | 2,017 | 6,394 | 974 | 164 | 810 | 15.2 | 2.6 | 6.9 | Coded band only |
Car rental franchise vs independent: receipts and staff per location
Franchise-system car rental establishments were smaller than the rest of the industry in 2017. Receipts per franchise establishment were $1,939,193, 0.72 times the $2,683,973 for non-franchise establishments (U.S. Census Bureau, 2017 Economic Census).
Inside the franchise group, owner type made almost no difference to receipts. Franchisee-owned locations averaged $1,930,183 and franchisor-owned locations $1,940,611. Franchisee-owned locations were more heavily staffed: 10.9 paid employees each, against 4.9.
Two cautions apply. The non-franchise group is a residual that includes establishments that did not answer, and it can include large operators that do not franchise. Receipts per establishment describe the industry, not the result any one location can expect; this report does not use or present earnings data.
| Industry (NAICS) | Owner type | Establishments | Receipts per establishment ($) | Paid employees per establishment |
|---|---|---|---|---|
| Passenger car rental (532111) | All franchise | 3,935 | 1,939,193 | 5.7 |
| Passenger car rental (532111) | Franchisee-owned | 535 | 1,930,183 | 10.9 |
| Passenger car rental (532111) | Franchisor-owned (company-operated) | 3,400 | 1,940,611 | 4.9 |
| Passenger car rental (532111) | Non-franchise (incl. no answer) | 8,274 | 2,683,973 | 9.2 |
| Truck, trailer and RV rental (532120) | All franchise | 974 | 1,604,045 | 3.1 |
| Truck, trailer and RV rental (532120) | Franchisee-owned | 164 | 6,022,311 | 14.1 |
| Truck, trailer and RV rental (532120) | Franchisor-owned (company-operated) | 810 | 709,483 | 0.9 |
| Truck, trailer and RV rental (532120) | Non-franchise (incl. no answer) | 5,420 | 3,860,430 | 10.3 |
What Avis Budget and Hertz report about licensees, FY2023 to FY2025
Of the three listed rental companies examined, Avis Budget Group is the only one that states licensee location counts by brand and region. Licensees ran about 3,700 of 10,250 locations in FY2023, 3,800 of 10,250 in FY2024 and 3,800 of 10,000 in FY2025 (FY2023 10-K, FY2024 10-K, Avis Budget Group FY2025 10-K).
Royalties from those licensees were $133 million, $143 million and $150 million, or 1.11%, 1.21% and 1.29% of total revenues. The filing states that Avis and Budget royalty fees were each about 1% of the brand’s revenues. Royalties are a fee on licensee revenue, not licensee revenue itself, which the 10-K does not report.
The licensee footprint is mostly international. In FY2025, licensees ran 1,505 of 2,375 international Avis locations and 445 of 2,320 in the Americas, a region that also covers Canada, Latin America and the Caribbean. Of the $150 million in royalties, $40 million came from the Americas.
Hertz reports company-operated and franchisee locations only as a combined count, about 11,400 in FY2023, 11,200 in FY2024 and 11,000 in FY2025 (FY2023 10-K, FY2024 10-K, Hertz FY2025 10-K). It states that fees from franchisees were about 2% of worldwide vehicle rental revenues in each year, and that U.S. franchisees can generally terminate without cause on 180 days’ notice.
One wording difference is worth flagging. The FY2023 and FY2024 Avis Budget filings say Avis-brand licensees operate approximately half of the brand’s locations worldwide; the FY2023 table shows 2,070 of 5,110 (40.5%). The FY2025 filing drops the sentence. This report uses the table counts. For unit growth across listed franchisors see public franchisor unit growth.
| Measure (as stated in the 10-K, approximate) | FY2023 | FY2024 | FY2025 |
|---|---|---|---|
| Avis Budget Group rental locations, worldwide | 10,250 | 10,250 | 10,000 |
| Avis Budget locations operated by licensees | 3,700 | 3,800 | 3,800 |
| Licensee share of Avis Budget locations (%) | 36.1 | 37.1 | 38 |
| Licensee royalty fee revenues ($ million) | 133 | 143 | 150 |
| Avis Budget total revenues ($ million) | 12,008 | 11,789 | 11,652 |
| Royalties as share of total revenues (%) | 1.11 | 1.21 | 1.29 |
| Avis brand licensee locations, Americas | 445 | 430 | 445 |
| Budget brand licensee locations, Americas | 485 | 530 | 525 |
| Licensee share of Avis plus Budget locations, Americas (%) | 21.3 | 21.5 | 22.7 |
| Licensee share of Avis plus Budget locations, International (%) | 59.4 | 60.3 | 62.2 |
| Payless locations operated by licensees | 160 | 175 | 195 |
| Hertz company-operated and franchisee locations, combined (no split disclosed) | 11,400 | 11,200 | 11,000 |
| Hertz fees from franchisees, share of worldwide vehicle rental revenues (%) | 2 | 2 | 2 |
| Hertz Americas off-airport share of locations (%) | 63.5 | 60 | 56.5 |
Airport vs neighborhood car rental franchise models
The filings do not count franchised locations by airport and off-airport type. Avis Budget describes licensed locations as ranging from large operations at major airports and whole-country territories to relatively small operations in suburban or rural locations (Avis Budget Group FY2025 10-K).
Hertz gives the airport mix for company-operated and franchisee locations combined. In its Americas segment, 2,000 of about 4,600 locations were at airports and 2,600 off airport at the end of 2025; the off-airport share fell from 63.5% in 2023 to 56.5% (Hertz FY2025 10-K).
The smaller franchisors price the two models differently. Priceless and NextCar charge $25,000 for a single point location with no territory and $30,000 for a six-mile primary service area. Airport fees depend on enplanements and car rental revenue statistics and run from $30,000 to $125,000 at Priceless (Priceless FDD, October 2025). Green Motion and U-Save quote $10,000 to $250,000 for a commercial or residential trade area and $25,000 to $800,000 for an airport (Green Motion FDD, U-Save FDD). Avis and Budget set the fee by territory population: $25,000 up to 50,000 people plus $5,000 per added 5,000, with the right to charge more for an airport, resort or other prime location.
Truck rental for contrast: dealers and dealerships, not franchisees
Truck, trailer and RV rental and leasing (NAICS 532120) is even less franchisee-owned. In 2017, 974 of 6,394 U.S. establishments (15.2%) were in a franchise system and 164 (2.6%) were franchisee-owned (U.S. Census Bureau, 2017 Economic Census).
The large consumer networks use commissioned dealers. U-Haul lists over 23,000 independent dealers and over 2,400 company-operated stores, and its dealers act as rental agents paid a commission on gross rental revenue (U-Haul FY2026 10-K). Budget Truck rents through about 800 company and dealer-operated U.S. locations, about half company-operated (Avis Budget Group FY2025 10-K).
The one truck franchise in this report’s FDD set is commercial leasing tied to truck dealers. PacLease lists 455 franchised and 2 company-owned U.S. outlets at the end of 2025, and its FDD says most franchises are owned by or affiliated with a Kenworth or Peterbilt dealership (PacLease FDD, February 2026). Leasing and rental of trucks share one NAICS code, so the Census figures cannot separate them.

Recent firm data: about one in eight vehicle rental firms franchise
The Annual Business Survey asks employer firms whether they operate all or part of the business as a franchise. For automotive equipment rental and leasing (NAICS 5321), the share was 12.1% in 2020, 13.4% in 2021, 12.0% in 2022 and 13.1% in 2023 (2024 ABS), against 4.7% for all sectors (Census ABS 2024).
The standard errors run from 3.2 to 5.4 points, so the year-to-year moves are noise. The ABS counts firms, not locations, reports no owner split, and stops at the 4-digit level, which mixes car rental with car leasing and truck rental. The 2019 file reaches only NAICS 532 (4.2%).
SBA loans for a car rental franchise: volume and median loan
SBA lending to car rental franchises is rare. From FY2011 to June 30, 2026, 17 SBA 7(a) and 504 loans ($12.05 million) carried a vehicle-rental franchise brand, about 1.1 a year, with a median of $428,100 (SBA 7(a) and 504 FOIA data as of June 30, 2026). Only 6 were approved from FY2020 on.
By industry code, SBA approved 392 7(a) loans to passenger car rental businesses from FY2010 ($105.9 million). 14 were franchise-coded (3.6%), against 10.1% of all 7(a) loans. The franchise-coded median was $430,000; the rest had a median of $50,000.
The SBA Franchise Directory gap does not explain the low share. SBA stopped publishing the directory when its rule took effect on 2023-05-11 (Federal Register) and reinstated it with SOP 50 10 8 on 2025-06-01 (SBA notice). Car rental loans approved before the gap had 2 franchise codes in 83; during it, 1 in 103; after it, 1 in 37.
Truck rental shows the same pattern. The 2 franchise-coded 7(a) loans recorded under NAICS 532120 went to dumpster and junk-removal brands, not truck rental systems. For lending across all franchise sectors, see SBA franchise loans and the SBA Franchise Directory report.
| Program | Industry (NAICS) | Loans | Gross approvals ($ million) | Franchise-coded loans | Franchise-coded share (%) | Median loan ($) |
|---|---|---|---|---|---|---|
| 7(a) | Passenger car rental (532111) | 392 | 105.9 | 14 | 3.6 | 54,200 |
| 7(a) | Truck, trailer and RV rental (532120) | 401 | 158.8 | 2 | 0.5 | 100,000 |
| 504 | Passenger car rental (532111) | 22 | 20.4 | 1 | 4.5 | 808,500 |
| 504 | Truck, trailer and RV rental (532120) | 37 | 32.1 | 0 | 0 | 537,000 |
| 7(a) and 504 | Vehicle-rental franchise brands, any NAICS | 17 | 12.05 | 17 | 100 | 428,100 |
What car rental franchise FDDs charge: fees tied to revenue, territory and fleet
This report read seven FDDs issued April 2024 to February 2026: four independent car rental brands (Priceless, NextCar, Green Motion and U-Save), the two Avis Budget car rental brands (Avis and Budget) and one truck leasing system (PacLease). Three fee features stand out.
Percent-of-revenue fees. Avis and Budget charge a 7.5% license fee on gross revenue. Priceless and NextCar charge the greater of 4% or a monthly minimum of $800 to $2,400, plus 1% for marketing. Green Motion and U-Save charge the greater of 6% or $500 to $1,500 a month, plus 2% for a marketing fund. PacLease charges 1% of revenue up to $6 million a year, 0.5% from $6 million to $12 million, and nothing above that.
Reservation costs. Bookings carry their own fees. Priceless lists $5 per brand-site reservation plus 5% of time and mileage revenue, and travel agency commissions of 10% to 35%. Green Motion lists broker commissions of 10% to 32% per reservation.
Fleet. The fleet dominates the investment. Vehicles are 82.2% of the high Avis and Budget Item 7 estimate (a 30-car fleet, financed), 86.8% at Priceless and 78.5% at NextCar. Several FDDs set fleet minimums: Priceless and NextCar guide one car per 1,000 residents in a six-mile territory by year three, and Green Motion and U-Save require 20 vehicles at opening and 50 by month six. Item 7 totals across the car rental FDDs run from $167,900 to $2,592,533.
Only Priceless and NextCar include an Item 19 financial performance representation; this report does not use it. For how these fees compare with other sectors, see franchise royalty rates and franchise initial investment. The automotive services view of the same FDDs is in automotive franchise statistics.
| Brand | FDD date | Initial fee ($) | Royalty or license fee | Marketing fee | Item 7 total low ($) | Item 7 total high ($) | Vehicle line, high ($) | Minimum fleet | U.S. outlets: franchised / company | Item 19 |
|---|---|---|---|---|---|---|---|---|---|---|
| Priceless Car & Truck Rental | 2025-10-06 | 25,000 single point; 30,000 six-mile; 30,000 to 125,000 airport | 4% of gross revenue or $800 to $2,400 monthly minimum | 1% or $500 | 265,384 | 2,592,533 | 2,250,000 | 1 car per 1,000 residents by year 3 (six-mile); 10 cars in year 1 (single point) | 35 / 0 | Yes |
| NextCar | 2025-10-06 | 25,000 single point; 30,000 six-mile; 27,500 to 125,000 airport | 4% of gross revenue or $800 to $2,400 monthly minimum | 1% or $500 | 315,384 | 1,592,533 | 1,250,000 | 1 car per 1,000 residents by year 3 (six-mile) | 12 / 17 | Yes |
| Green Motion | 2025-05-27 | 10,000 to 250,000 local; 25,000 to 800,000 airport | 6% of gross revenue or $500 to $1,500 monthly minimum | 2% or $500 | 167,900 | 1,547,250 | 500,000 | 20 vehicles at opening; 50 by month 6 | 0 / 6 | No |
| U-Save Car & Truck Rental | 2025-05-27 | 10,000 to 250,000 local; 25,000 to 800,000 airport | 6% of gross revenue or $500 to $1,500 monthly minimum | 2% or $500 | 167,900 | 1,547,250 | 500,000 | 20 vehicles at opening; 50 by month 6 | 72 / 0 | No |
| Avis | 2024-04-29 | 25,000 up to 50,000 people plus 5,000 per added 5,000 | 7.5% of gross revenue | $0 (not collected) | 605,500 | 1,568,400 | 1,290,000 | Estimate assumes a 30-car fleet | 169 / 1,691 | No |
| Budget | 2024-04-29 | 25,000 up to 50,000 people plus 5,000 per added 5,000 | 7.5% of gross revenue | Not listed | 605,500 | 1,568,400 | 1,290,000 | Estimate assumes a 30-car fleet | 177 / 1,197 | No |
| PacLease (truck leasing and rental) | 2026-02-18 | 4,000 per base location | 1% of revenue to $6 million, 0.5% from $6 million to $12 million, 0% above; plus $550 a month | None listed | 554,250 | 904,250 | Not in total (per-vehicle $100,000 to $150,000) | Not stated | 455 / 2 | No |
Does the licensee pattern hold? Testing the car rental franchise hypothesis
The working hypothesis was that car rental is heavily franchised by location count, concentrated in neighborhood and smaller-market licensees of the big systems, which report franchised locations as a large share of locations but a small share of revenue.
Held: small share of revenue. Avis Budget licensee royalties were 1.29% of revenue in FY2025 while licensees ran 38.0% of locations; Hertz franchisee fees were about 2% of vehicle rental revenues.
Held only abroad: large share of locations. Licensees ran 62.2% of Avis and Budget international locations. In the United States the share is small: 10.7% of Avis and Budget outlets in the FDDs and 4.4% of all car rental establishments in the 2017 Census. U.S. franchised outlets at the two brands fell by 35 from the start of 2021 to the end of 2023.
Not supported: smaller locations. Franchisee-owned car rental establishments had about the same receipts per location as company-operated franchise locations in 2017 and about twice the staff. No filing counts licensees by market size. The finding the data supports: U.S. car rental is a branded, company-operated industry, and franchising is mainly how the big systems cover places they do not run directly, chiefly outside the United States.
Original analysis: how we calculated it
Franchised share and owner type, passenger car rental, 2007 to 2017
- Formula
franchise share = franchise establishments / all establishments; franchisee-owned share = franchisee-owned / all; franchisor-owned share of franchise = franchisor-owned / franchise- Inputs
- E07_532111_fr, E07_532111_all, E12_532111_fr, E17_532111_fr, E17_532111_fee, E17_532111_sor, E17_532111_all
- Result
- Franchise share 39.7% (2007), 12.2% (2012), 32.2% (2017); franchisee-owned 35.3%, 8.3%, 4.4%; franchisor-owned 86.4% of franchise establishments in 2017
- Limitations
- Self-reported status, partial coverage (47.6% of sales in 2007, 71.4% in 2012); not a trend
Receipts per location, franchise vs independent, 2017
- Formula
receipts ($1,000) x 1,000 / establishments; non-franchise = all minus franchise- Inputs
- E17_532111_rcpt_fr, E17_532111_fr, E17_532111_rcpt_all, E17_532111_all, E17_532111_rcpt_fee, E17_532111_fee
- Result
- $1,939,193 franchise vs $2,683,973 non-franchise (ratio 0.72); franchisee-owned $1,930,183 vs franchisor-owned $1,940,611
- Limitations
- Non-franchise is a residual including non-respondents and large non-franchising operators
Licensee locations vs royalty revenue, Avis Budget Group, FY2023 to FY2025
- Formula
licensee share = licensee locations / all locations; royalty share = licensee royalties / total revenues- Inputs
- K23_car_lic, K23_car_loc, K23_car_roy, K23_car_rev, K25_car_lic, K25_car_loc, K25_car_roy, K25_car_rev
- Result
- Locations 36.1%, 37.1%, 38.0%; royalties 1.11%, 1.21%, 1.29% of revenue
- Limitations
- Approximate counts; royalties are fees, not licensee sales; Hertz gives no location split
SBA lending to car rental franchise brands
- Formula
count, sum and median of 7(a) and 504 approvals whose FranchiseName is a vehicle-rental brand- Inputs
- Bcar_both_loans, Bcar_both_usd, Bcar_both_med, Ba7_532111_frshare, Ba7_all_frshare
- Result
- 17 loans, $12.05 million, median $428,100, about 1.1 a year; 3.6% of car rental 7(a) loans franchise-coded vs 10.1% overall
- Limitations
- Franchise coding depends on the SBA Franchise Directory (withdrawn 2023-05-11 to 2025-05-31)
FDD fee structure: percent fees and fleet share of investment
- Formula
royalty % + marketing %; vehicle line / high Item 7 total- Inputs
- F_priceless_pctload, F_greenmotion_pctload, F_avis_pctload, F_priceless_vehshare_high, F_avis_vehshare_high, F_nextcar_vehshare_high
- Result
- Percent fees 5% (Priceless, NextCar), 7.5% (Avis, Budget), 8% (Green Motion, U-Save); vehicles 78.5% to 86.8% of the high Item 7 in four FDDs and 32.3% in two
- Limitations
- Seven FDDs from five franchisor groups; minimums, reservation fees and commissions excluded
Three lenses on U.S. franchising: Census, FDD, 10-K
- Formula
compare franchisee-owned share (Census), franchised share of U.S. outlets (FDD Item 20) and Americas licensee share (10-K)- Inputs
- E17_532111_feeshare, F_ab_us_frshare, K25_ab_am_licshare
- Result
- 4.4% (Census 2017), 10.7% (Avis and Budget FDDs, 2023), 22.7% (Avis and Budget, Americas, FY2025)
- Limitations
- Different years, units (establishments, outlets, locations) and geographies
What a buyer should check before a car rental franchise
These are the points the filings and FDDs above show to vary most. They are questions to ask, not advice.
- Territory type and fee basis: single point, radius, population or airport, and whether airport fees are set by enplanements or rental revenue (Item 5 and Item 12).
- Minimum royalty and minimum fleet: whether the percentage fee has a monthly floor, and the fleet size required by month six or year three (Item 6 and Item 12).
- Reservation and commission costs: per-reservation fees and travel agency or broker commissions (Item 6).
- Fleet financing: whether Item 7 assumes financed vehicles and who provides the financing (Item 7 and Item 10).
- Outlet history: franchised vs company-owned counts and reacquisitions (Item 20). Avis Budget states that it periodically acquires licensees.
- Financial performance: whether the FDD has an Item 19 at all (see franchise Item 19).
For the general process, see buying a franchise and franchise costs.
Where the data stops
No public source counts U.S. car rental locations by franchise status after 2017. The 2022 Economic Census did not tabulate franchise status for the United States, the ABS stops at 4-digit industries and counts firms, and the 10-K filings report approximate worldwide or regional counts. Enterprise Holdings does not appear in the SEC list of companies with traded securities and has no franchise registration in the DFPI index, so it is outside the filing and FDD data. Hertz does not split company and franchisee locations. No source reports licensee sales.
Questions people ask
Can you buy a car rental franchise?
Yes. Avis and Budget each list franchised U.S. outlets (169 and 177 at the end of 2023), and smaller systems such as U-Save (72 franchised outlets at the end of 2024) and Priceless (35) are fully franchised, according to their FDDs. Most U.S. car rental locations are company-run: only 4.4% were franchisee-owned in the 2017 Economic Census.
How much does a car rental franchise cost?
Item 7 estimates in seven FDDs issued 2024 to 2026 run from $167,900 (Green Motion and U-Save, low end) to $2,592,533 (Priceless, high end). Avis and Budget estimate $605,500 to $1,568,400 for a 30-car fleet and a territory of 55,000 people. Vehicles are most of the cost: 82.2% of the Avis high estimate. See franchise costs.
How do car rental franchises make money?
This report covers fee structures only, not earnings. Franchisees rent vehicles and pay the franchisor a share of gross revenue: 7.5% at Avis and Budget, 4% plus 1% marketing at Priceless and NextCar, 6% plus 2% at Green Motion and U-Save, often with a monthly minimum. Reservations add per-booking fees and commissions. For earnings data, read Item 19 of the FDD.
What percentage of car rental locations are franchised?
In the 2017 Economic Census, 32.2% of U.S. passenger car rental establishments were in a franchise system and 4.4% were franchisee-owned. Avis and Budget list 10.7% of U.S. outlets as franchised (2023). Worldwide, licensees ran 38.0% of Avis Budget locations in FY2025.
Can you get an SBA loan for a car rental franchise?
It is possible but rare. SBA data show 17 7(a) and 504 loans coded to a vehicle-rental franchise brand from FY2011 to June 30, 2026, with a median of $428,100. Of 392 7(a) loans to car rental businesses since FY2010, 3.6% were franchise-coded. Avis and Budget expect franchisees to finance 100% of the fleet.
Frequently asked questions
Is Enterprise Rent-A-Car a franchise?
Enterprise Holdings does not appear in the SEC company tickers list, and no Enterprise franchise registration appears in the California DFPI franchise index or in this site’s 259-FDD Minnesota sample. This report therefore has no filing or FDD data for it.
How many car rental locations are there in the United States?
The 2017 Economic Census counted 12,209 passenger car rental establishments. BLS QCEW counted 9,933 private establishments in 2025, up 3.3% from 2017, with employment down 13.1% to 106,822. The two sources count locations differently.
What is the royalty for a car rental franchise?
Between 4% and 7.5% of gross revenue in the FDDs read: 4% (Priceless, NextCar), 6% (Green Motion, U-Save) and 7.5% (Avis, Budget), several with monthly minimums.
What is the franchise fee for an Avis or Budget franchise?
The April 2024 FDDs set the Initial License Purchase Fee at $25,000 for a territory of up to 50,000 people plus $5,000 for each added 5,000, so $30,000 for the 55,000-person example. The franchisor may charge more or less for airports or other prime locations.
Why are airport car rental franchise fees higher?
Priceless and NextCar set airport fees by enplanement and car rental revenue statistics, from $27,500 to $125,000; Green Motion and U-Save quote up to $800,000 for an airport trade area against $250,000 for a local one (FDDs issued 2025).
How much of Avis Budget's revenue comes from licensees?
Licensee royalties were $150 million in FY2025, 1.29% of $11,652 million total revenues, according to the FY2025 10-K.
Does Hertz franchise in the United States?
Yes. Hertz’s FY2025 10-K says it licenses independent operators in certain U.S. and international markets under the Hertz, Dollar and Thrifty brands, and that U.S. franchisees can generally terminate on 180 days’ notice. It does not disclose how many locations are franchised.
Is U-Haul a franchise?
Not in its filings. U-Haul’s FY2026 10-K does not use the word franchise (0 mentions); it describes over 23,000 independent dealers that act as rental agents and are paid a commission on gross rental revenue, alongside over 2,400 company-operated stores.
How many truck rental locations are franchised?
In 2017, 2.6% of U.S. truck, trailer and RV rental and leasing establishments were franchisee-owned (164 of 6,394). PacLease, a truck leasing franchise, listed 455 franchised U.S. outlets at the end of 2025.
Is there newer Census franchise data than 2017?
Not at the location level. The 2022 Economic Census franchise table covers Puerto Rico only. The Annual Business Survey gives firm-level shares: 13.1% of automotive equipment rental and leasing firms operated as a franchise in 2023 (2024 ABS).
For journalists
Most quotable statistics
Only 4.4% of U.S. passenger car rental establishments were franchisee-owned in 2017, although 32.2% belonged to a franchise system, according to the 2017 Economic Census.
U.S. Census Bureau, 2017 Economic CensusIn 2017, 86.4% of U.S. car rental franchise establishments were company-operated by the franchisor, against 17.4% across all industries.
U.S. Census Bureau, 2017 Economic CensusAvis Budget Group licensees ran 38.0% of the group’s worldwide rental locations in FY2025 but paid royalties equal to 1.29% of its revenue.
Avis Budget Group Form 10-K, FY2025Avis and Budget listed 10.7% of their U.S. outlets as franchised at the end of 2023, according to their April 2024 FDDs.
Avis and Budget FDDs (California DFPI)From FY2011 to June 2026, SBA approved 17 7(a) and 504 loans to vehicle-rental franchise brands in the United States, about 1.1 a year.
SBA 7(a) and 504 FOIA dataVehicles account for 82.2% of the high-end initial investment in the 2024 Avis and Budget FDDs, which assume a 30-car fleet.
Avis and Budget FDDs, 2024-04-29
If you cite only a few, cite these
- 4.4% of U.S. car rental establishments franchisee-owned (2017 Economic Census). source
- Avis Budget licensees: 38.0% of locations, royalties 1.29% of revenue (FY2025 10-K). source
- 17 SBA loans to vehicle-rental franchise brands, FY2011 to June 2026 (SBA FOIA). source
Press summary and suggested headlines
Car rental in the United States carries franchise brands but is mostly run by the brand owners, a study of Census, SEC and franchise disclosure data by Franchise Consultants and Brokers finds. In the 2017 Economic Census, 32.2% of 12,209 passenger car rental establishments were part of a franchise system, but only 4.4% were franchisee-owned; the rest of the franchise group was company-operated. Avis and Budget list 10.7% of U.S. outlets as franchised in their 2024 disclosure documents. Abroad the picture flips: licensees ran 62.2% of Avis and Budget international locations in FY2025, yet licensee royalties were only 1.29% of Avis Budget revenue. SBA lending to rental franchise brands totals 17 loans since FY2011. Current FDDs charge 4% to 7.5% of gross revenue and price airport territories well above neighborhood sites. The data tables are free to reuse under CC BY 4.0.
Suggested headlines
- Only 4.4% of U.S. car rental locations are franchisee-owned, Census data show
- Avis Budget licensees run 38.0% of locations but pay 1.29% of revenue
- For Avis Budget, car rental franchising is mostly an overseas business
- SBA has backed 17 car rental franchise loans in 16 years
- Airport car rental franchise fees run up to $800,000, FDDs show
Methodology
Question and scope. How franchised U.S. passenger car rental (NAICS 532111) is, with truck, utility trailer and RV rental and leasing (NAICS 532120) for contrast; what listed rental companies state about licensee and franchised locations; how much SBA lending reaches rental franchises; and what rental FDDs charge. Passenger car leasing (532112) is shown only where it adds context.
Sources and selection. Primary sources only for every statistic: Census Economic Census franchise files for 2007, 2012 and 2017 (2017 is the latest U.S. tabulation; the 2022 census tabulated franchise status for Puerto Rico only), Annual Business Survey Characteristics of Businesses files for data years 2019 to 2023, SBA 7(a) and 504 FOIA loan files as of 2026-06-30, BLS QCEW annual averages, Form 10-K filings on SEC EDGAR (Avis Budget Group and Hertz Global for FY2023 to FY2025; U-Haul Holding for fiscal years ended March 2024 to March 2026), and seven FDDs: four from this site’s Minnesota CARDS corpus (local copies of the registered PDFs; CARDS was not re-queried) and three from California DFPI public filing records. Market research estimates and roundup pages were not used.
Inclusion rules. 10-K facts are used only as stated in the filing, with the filing year. Rental FDDs were found by searching the 259-FDD corpus for rental terms (four hits) and the DFPI franchise index for rental brands; for each brand the newest application with a downloadable FDD was used. Budget and Payless 2026 applications timed out on the DFPI document service; Budget’s 2025 application holds no FDD; Hertz, Dollar and Thrifty have no DFPI registration application effective 2025 or later (Hertz System and Thrifty list exemption notices filed 2022 to 2024), so no current FDD was available for them. FDD values were read by hand and each one is checked against the FDD text by script (07_fdd.py). Item 19 is recorded only as present or absent.
SBA coding. Industry is the NAICS code on the loan. Franchise-coded means a non-blank FranchiseCode. Vehicle-rental brand loans were found by searching every FranchiseName for rental terms and keeping only rental systems (Avis, Budget Rent A Car, Dollar Rent A Car, Hertz, Priceless, Rent-A-Wreck, Thrifty and U-Save). Borrower names and addresses were never loaded. Loans approved between 2023-05-11 and 2025-05-31, when the SBA Franchise Directory was withdrawn, are coded less often; this is a reporting artifact.
Conflicting numbers. The Census owner split moves sharply between 2007, 2012 and 2017; the report presents 2017 as the latest snapshot and does not read the change as a trend. Where the Avis Budget text (‘approximately half’) and its location table (about 40% for the Avis brand in FY2023) differ, the table is used. Census establishments and QCEW establishments are different counts and are not combined.
Derived metrics. Shares, per-establishment figures, ratios and medians are computed by the scripts in this report’s scripts folder; every formula and input row is listed in derived.csv and in the method_notes column of factsheet.csv.
Limitations. Census franchise status is self-reported and the non-franchise group includes non-respondents. The ABS is firm-level, 4-digit and has standard errors of 3 to 5 points. 10-K counts are approximate and regional. Seven FDDs from five franchisor groups are not a census of rental franchisors. Enterprise Holdings is outside the filing and FDD data. Last updated 2026-10-18.
License. Data tables and charts: CC BY 4.0, attribution “Franchise Consultants and Brokers, franchiseconsultantsandbrokers.com”.
Sources and source quality
Tier 1: primary and government sources (28)
- 2017 Economic Census, Franchise Status for the U.S. and States (EC1700FRAN), bulk file, U.S. Census Bureau (accessed 2026-10-18)
- 2012 Economic Census, Franchise Status (EC1200CFRA1), bulk file, U.S. Census Bureau (accessed 2026-10-18)
- 2007 Economic Census, Franchise Status (EC0700CFRA1), bulk file, U.S. Census Bureau (accessed 2026-10-18)
- 2022 Economic Census data release schedule and table list, U.S. Census Bureau (accessed 2026-10-18)
- New Franchise Statistics Report From 2017 Economic Census (tip sheet CB21.TPS.95), U.S. Census Bureau (accessed 2026-10-18)
- Annual Business Survey 2020 (data year 2019), Characteristics of Businesses (AB1900CSCB01), U.S. Census Bureau (accessed 2026-10-18)
- Annual Business Survey 2021 (data year 2020), Characteristics of Businesses (AB2000CSCB01), U.S. Census Bureau (accessed 2026-10-18)
- Annual Business Survey 2022 (data year 2021), Characteristics of Businesses (AB2100CSCB01), U.S. Census Bureau (accessed 2026-10-18)
- Annual Business Survey 2023 (data year 2022), Characteristics of Businesses (AB2200CSCB01), U.S. Census Bureau (accessed 2026-10-18)
- Annual Business Survey 2024 (data year 2023), Characteristics of Businesses (AB2300CSCB01), U.S. Census Bureau (accessed 2026-10-18)
- Annual Business Survey methodology (2024 ABS), U.S. Census Bureau (accessed 2026-10-18)
- Upcoming data releases (census.gov), U.S. Census Bureau (accessed 2026-10-18)
- SBA 7(a) and 504 FOIA loan data, files as of June 30, 2026, U.S. Small Business Administration (accessed 2026-10-18)
- Final rule, Affiliation and Lending Criteria for the SBA Business Loan Programs (88 FR 21074, 2023-04-10), U.S. Small Business Administration (Federal Register) (accessed 2026-10-18)
- Information Notice 5000-866746, Issuance of SOP 50 10 8, U.S. Small Business Administration (accessed 2026-10-18)
- QCEW open data, 2017 annual averages, NAICS 532111, U.S. Bureau of Labor Statistics (accessed 2026-10-18)
- QCEW open data, 2025 annual averages, NAICS 532111, U.S. Bureau of Labor Statistics (accessed 2026-10-18)
- QCEW open data, 2017 annual averages, NAICS 532120, U.S. Bureau of Labor Statistics (accessed 2026-10-18)
- QCEW open data, 2025 annual averages, NAICS 532120, U.S. Bureau of Labor Statistics (accessed 2026-10-18)
- Priceless Car & Truck Rental Franchise Disclosure Document, issued 2025-10-06, Minnesota Department of Commerce (CARDS) (accessed 2026-10-18)
- NextCar Franchise Disclosure Document, issued 2025-10-06, Minnesota Department of Commerce (CARDS) (accessed 2026-10-18)
- Green Motion Car and Van Rental Franchise Disclosure Document, issued 2025-05-27, Minnesota Department of Commerce (CARDS) (accessed 2026-10-18)
- PacLease Franchise Disclosure Document, effective 2026-02-18, Minnesota Department of Commerce (CARDS) (accessed 2026-10-18)
- U-Save Car & Truck Rental Franchise Disclosure Document, issued 2025-05-27 (application APP00002770), California Department of Financial Protection and Innovation (accessed 2026-10-18)
- Avis Rent A Car System Franchise Disclosure Document, issued 2024-04-29 (application app-31752), California Department of Financial Protection and Innovation (accessed 2026-10-18)
- Budget Rent A Car System Franchise Disclosure Document, issued 2024-04-29 (application app-31753), California Department of Financial Protection and Innovation (accessed 2026-10-18)
- Company tickers list (company_tickers.json), U.S. Securities and Exchange Commission (accessed 2026-10-18)
- DFPI public search index, franchise regulated entities (queried by 04a_dfpi_search.py), California Department of Financial Protection and Innovation (accessed 2026-10-18)
Tier 2: trade bodies, market research, company filings (9)
- Avis Budget Group, Form 10-K for fiscal year 2023 (filed 2024-02-16), Avis Budget Group (SEC EDGAR) (accessed 2026-10-18)
- Avis Budget Group, Form 10-K for fiscal year 2024 (filed 2025-02-14), Avis Budget Group (SEC EDGAR) (accessed 2026-10-18)
- Avis Budget Group, Form 10-K for fiscal year 2025 (filed 2026-02-19), Avis Budget Group (SEC EDGAR) (accessed 2026-10-18)
- Hertz Global Holdings, Form 10-K for fiscal year 2023 (filed 2024-02-12), Hertz Global Holdings (SEC EDGAR) (accessed 2026-10-18)
- Hertz Global Holdings, Form 10-K for fiscal year 2024 (filed 2025-02-18), Hertz Global Holdings (SEC EDGAR) (accessed 2026-10-18)
- Hertz Global Holdings, Form 10-K for fiscal year 2025 (filed 2026-02-26), Hertz Global Holdings (SEC EDGAR) (accessed 2026-10-18)
- U-Haul Holding Company, Form 10-K for fiscal year ended March 31, 2024 (filed 2024-05-30), U-Haul Holding Company (SEC EDGAR) (accessed 2026-10-18)
- U-Haul Holding Company, Form 10-K for fiscal year ended March 31, 2025 (filed 2025-05-29), U-Haul Holding Company (SEC EDGAR) (accessed 2026-10-18)
- U-Haul Holding Company, Form 10-K for fiscal year ended March 31, 2026 (filed 2026-05-27), U-Haul Holding Company (SEC EDGAR) (accessed 2026-10-18)
Related research
Automotive Franchise Statistics
100% of US new car dealer establishments franchised, 2017
Read the research
Fitness Franchise Statistics
26.6% of U.S. fitness and recreational sports centers were franchise establishments (2017)
Read the research
Franchise PPP Loans and Restaurant Revitalization Grants
150,086: Franchise-flagged PPP loans, both draws, US, April 2020 to July 2021 ($25.45B)
Read the research
Hotel Franchise Statistics
57.9% of U.S. hotel and motel establishments were franchises (2017, latest Census count)
Read the researchHow to cite and reuse
Franchise Consultants and Brokers Editorial Team. "Car Rental Franchise Statistics: Who Owns the Locations, What Licensees Pay." Franchise Consultants and Brokers, updated October 18, 2026. https://franchiseconsultantsandbrokers.com/research/car-rental-franchise-statistics/
The data tables and charts on this page are licensed under CC BY 4.0. Please credit “Franchise Consultants and Brokers, franchiseconsultantsandbrokers.com” with a link to this page.
Download the data
- Fact sheet, every statistic with source (CSV)
- Derived metrics with formulas (CSV)
- Census franchise owner split, 2007 to 2017 (CSV)
- Receipts and staff per establishment, 2017 (CSV)
- 10-K licensee counts and fees, FY2023 to FY2025 (CSV)
- SBA loans to rental businesses (CSV)
- FDD fee and investment terms (CSV)
- Seven measures of how franchised car rental is (CSV)
- SBA car rental loans by fiscal year (CSV)
- Full fact sheet with sources (CSV)