
Franchise advantages and disadvantages, measured: the disadvantages of operating a franchise are a median 8% of sales in fees, an uncapped personal guarantee (96.1% of FDDs) and required suppliers (99.2%); the survival advantage is mostly a year-one effect.
Key takeaways
- The survival edge is real but short. Franchised startups were 5.1 percentage points more likely to survive year one in Census Bureau microdata on 2002 and 2007 startups, and the extra edge in year three, for firms that survived year two, was not statistically significant.
- The “95% succeed” figure is franchisor-reported. A 1992 IFA-sponsored survey asked franchisors, not franchisees, and reported 96.9% of recent units still open (Bates, Census CES 97-5).
- Loans cost less, but startups default more. Franchise SBA 7(a) loans priced at a median 2.25 points over prime against 2.75 for other 7(a) loans in April to June 2026, yet 11.3% of franchise startup loans from FY2010 to FY2019 were charged off against 7.7% (SBA 7(a) FOIA data).
- The brand edge depends on the industry. Franchise units out-sold same-industry independents in 15 of 24 top franchise industries in 2017 but in only 100 of 266 industries in total (2017 Economic Census).
- Personal liability is the con most guides skip. 97.3% of 259 FDDs issued 2025 to 2026 require or provide for an owner guarantee, and 35.5% make spouses sign one (Minnesota CARDS filings).
| Measure | Value | Base and date | Source |
|---|---|---|---|
| Median royalty | 6% of sales | 239 FDDs, issued 2025 to 2026 | FDD Item 6, Minnesota CARDS |
| Median of all percentage-of-sales fees | 8% | 239 FDDs; 17.6% reach 10% or more | FDD Item 6, Minnesota CARDS |
| Median initial training | 76 hours | 252 brands, 2025 to 2026 | FDD Item 11, Minnesota CARDS |
| Median outlets lost in one year | 4.7% of franchised outlets | 220 systems, mostly FY2025 | FDD Item 20, Minnesota CARDS |
| Median fixed transfer fee | $10,000 | 245 FDDs, 2025 to 2026 | FDD Item 6, Minnesota CARDS |
| Median franchise SBA 7(a) rate | 9.00% | 1,805 loans, April to June 2026 | SBA 7(a) FOIA |
Which franchise claims hold up when you check the data?
Of 13 claims that recur in franchise pros and cons lists, 7 come out weaker than usually stated, 3 come out stronger and 3 hold as stated once measured. The table grades each one against Census studies, SBA loan outcomes or counts from 259 franchise disclosure documents (FDDs) filed in Minnesota and issued 2025 to 2026.
| Common claim | What the data shows | Verdict | Source |
|---|---|---|---|
| Franchises fail far less often | Year-one survival edge of 5.1 points after controls; no significant extra edge in year three. Young firms tracked 1987 to 1991: 65.3% of franchises vs 72.0% of independents survived | Weaker | Census CES 17-21; CES 94-3 |
| 95% of franchises succeed | Traced to franchisor surveys: a 1992 IFA-sponsored survey reported 96.9% of units still open and did not ask franchisees | Weaker | Census CES 97-5 |
| A known brand lifts sales | Higher average sales than independents in 15 of 24 top franchise industries, but 100 of 266 industries in total (2017) | Holds in some industries | Economic Census EC1700FRAN |
| Lenders prefer franchises | Median spread over prime 2.25 points vs 2.75 for other SBA 7(a) loans, April to June 2026 | Stronger | SBA 7(a) FOIA |
| Franchise loans are safer bets | Startup loans FY2010 to FY2019 charged off at 11.3% (franchise) vs 7.7% (non-franchise) | Weaker for startups | SBA 7(a) FOIA |
| You get full training | Median initial program 76 hours; franchisee pays trainee travel at 89.1% of brands | Smaller than implied | FDD Item 11 |
| National advertising works for you | Median brand fund 2% of sales; 17 of 207 active funds (8.2%) audited in any form | Weaker on accountability | FDD Item 11 |
| Group buying power saves money | 99.2% restrict purchases; in 77.2% the franchisor or an affiliate earned revenue from them; 16 of 124 rebate recipients pass some back | Weaker | FDD Item 8 |
| You get a protected territory | 81.1% protect some area, but 92.9% of those keep online sales rights and 53.3% can be cut | Weaker | FDD Item 12 |
| Fees take a cut of sales | Median royalty 6%; all percentage fees median 8%; 40.2% set a minimum royalty | Holds as stated | FDD Item 6 |
| A franchise is hard to sell | Transfers were 43.2% of 5,416 turnover events; 97.7% charge a transfer fee, median $10,000 | Holds, with a price tag | FDD Items 6 and 20 |
| You only risk what you invest | 97.3% provide for an owner guarantee; 96.1% set no dollar cap; 35.5% require spouses to sign | Stronger con | Franchise agreements |
| You give up control | 99.6% of renewable agreements renew on the then-current contract; 71.4% require binding arbitration | Stronger con | FDD Item 17 |
Of 259 FDDs issued 2025 to 2026, 99.2% restrict purchases, 97.3% provide for an owner guarantee and 96.1% leave it uncapped; 40.2% set a minimum royalty. Source: Minnesota CARDS filings, FCB coding.
The FTC staff saw the same pattern from the franchisee side: of 5,291 comments to its 2023 request for information, the top concerns included unilateral changes to operating manuals, fees and royalties, and supply restrictions with vendor kickbacks (FTC Issue Spotlight, July 2024).
What are the disadvantages of operating a franchise?
The main disadvantages of operating a franchise are recurring fees taken from sales, a personal guarantee with no cap, purchases restricted to approved suppliers, contract terms that the franchisor can reset at renewal, and a territory that is rarely exclusive. Each one is written into specific items of the FDD, which lets a buyer price it before signing.
How much of each sales dollar goes back to the franchisor?
The median royalty was 6% of sales across 239 FDDs with a percentage royalty, and royalty plus brand fund plus other percentage fees reached a median 8%, per our franchise royalty rate data. 42 FDDs (17.6%) reached 10% or more. Fixed recurring fees on top had a median of $5,500 a year, and 104 of 259 FDDs (40.2%) set a minimum royalty that applies in slow months.
Who is personally on the hook if the business fails?
Nearly every owner is. 252 of 259 FDDs (97.3%) require or provide for a personal guarantee, 249 (96.1%) set no dollar cap, and 214 of 247 guarantee forms (86.6%) let the franchisor pursue the guarantor without first pursuing the company. Only 3 forms cap the amount, as our franchise personal guarantee study details.
Who profits from the supplies you are required to buy?
Often the franchisor. In 200 of 259 FDDs (77.2%) the franchisor or an affiliate received revenue from franchisees’ required purchases, and 124 (47.9%) reported supplier rebates. Of those 124, 16 (12.9%) pass some back to franchisees. The median FDD restricts 70% of startup purchases and 50% of ongoing ones, per our supplier rebate analysis.
How much control do you give up, and where do disputes go?
Renewal is where control shifts: 99.6% of 245 renewable agreements require signing the franchisor’s then-current contract, and 83.7% require a remodel or upgrade. Disputes usually leave your state: 71.4% of 259 FDDs require binding arbitration and 96.5% of franchisors naming a court venue pick their home state, per our franchise agreement terms review.
Is your territory actually protected?
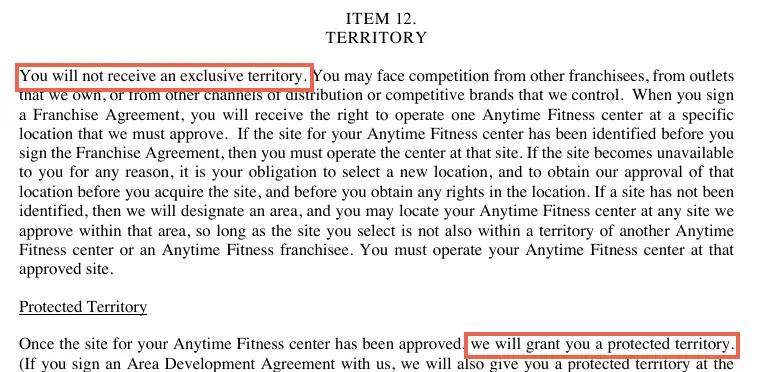
Partly. 221 of 259 FDDs (85.3%) print the federal sentence “You will not receive an exclusive territory,” yet 173 of those still promise a protected area. 195 of 210 protected areas (92.9%) let the franchisor sell online inside them, and 112 (53.3%) can be cut, per our franchise territory rights data. The Anytime Fitness FDD shows both sentences on one page.
What are the advantages of operating a franchise?
The measurable advantages of operating a franchise are a first-year survival edge of about 5 points, SBA loan pricing about half a point cheaper, higher average sales in restaurant and hotel industries, a structured training program and an active resale market. Each advantage is narrower than franchise marketing suggests, and each has a number a buyer can check.
Does a franchise survive its first year more often?
Yes, by a modest margin. In the 2002 Census cohort, 98.3% of franchised single-unit startups survived one year against 92.3% of independents. After controls for owner and business traits, the edge was 5.1 points in year one, and the extra advantage in year two was about 2.1 points, per Lafontaine, Zapletal and Zhang (CES 17-21).
Is SBA financing cheaper for a franchise?
On price, yes. Franchise-coded SBA 7(a) loans approved April 1 to June 30, 2026 had a median rate of 9.00%, 2.25 points over the 6.75% prime rate, against a 2.75-point spread on 12,551 other 7(a) loans. The franchise spread stayed at 2.25 or 2.50 points in all 27 quarters since FY2020, per our franchise loan interest rate tracker.
Does the brand lift sales?
In restaurants and hotels, the Census data says yes. In 2017, franchise limited-service restaurants averaged 1.59 times the sales of independent ones and franchise hotels 1.54 times. Across all 266 comparable industries, franchise units out-sold independents in only 100, per our franchise vs independent business report.
How much training and support comes with the fee?
About two working weeks. The median initial program is 76 hours across 252 brands, 28.2% need 40 hours or fewer, and 73.9% provide initial training free or inside the franchise fee. The franchisee pays trainees’ travel and lodging at 89.1% of brands, according to our franchise training program data. Brand funds add a median 2% of sales for marketing, though only 8.2% of active funds are audited, per our advertising fund review.
Is it easier to sell a franchise than an independent business?
The resale market is more active. Transfers to new owners were the largest form of turnover, 43.2% of 5,416 events in 220 systems’ latest Item 20 tables, and 14.9% of franchise SBA 7(a) loans from FY2020 to June 2026 financed a change of ownership against 9.8% for other loans (SBA 7(a) FOIA). The franchisor still approves the buyer and charges a fee, a median $10,000 in our franchise transfer fee data.
Do franchises really fail less often than independent businesses?
Only in the first year or two, and only in the strongest study. Census microdata on 2002 and 2007 startups found a 5.1-point year-one edge, while Census survey data on firms active in 1987 and a Kauffman Firm Survey cohort started in 2004 found franchises survived no better, or worse, than independents. Most “franchises rarely fail” claims trace back to franchisor-reported surveys.
Franchises led on one- and two-year survival for 2002 startups (98.3% vs 92.3%; 90.4% vs 81.7%) but trailed in 1987 to 1991 firms (65.3% vs 72.0%) and 2004 starts (60% vs 63%). Sources: Census CES 17-21, CES 94-3; Cotei and Farhat 2024.
The studies measure different things. Lafontaine and colleagues compared single-establishment startups in franchise-heavy industries; Bates (CES 94-3) compared young firms of all kinds and found 65.3% of franchises and 72.0% of independents still operating in late 1991, a gap significant at the 5% level. Cotei and Farhat (2024) found no significant difference for 2004 startups tracked eight years.
Unit counts can flatter franchising. Bates found that 84% of new franchise restaurant establishments in 1986 and 1987 belonged to multi-unit companies, which survive better than first-time owners (CES 97-5). The table converts the published rates into outcomes per 1,000 startups so the gaps are comparable.
| Measure (source) | Franchise, per 1,000 | Independent, per 1,000 | Difference |
|---|---|---|---|
| Survived year 1, 2002 starts (CES 17-21): 98.3% vs 92.3% | 983 | 923 | 60 more franchises |
| Survived year 2, 2002 starts (CES 17-21): 90.4% vs 81.7% | 904 | 817 | 87 more franchises |
| Still operating late 1991, firms active 1987 (CES 94-3): 65.3% vs 72.0% | 653 | 720 | 67 fewer franchises |
| Still operating 2011, 2004 starts (Kauffman): 60% vs 63% | 600 | 630 | 30 fewer franchises (not significant) |
| SBA startup loans charged off, FY2010 to FY2019: 11.3% vs 7.7% | 113 | 77 | 36 more franchise charge-offs |
System choice matters more than the franchise label. In 220 systems’ latest FDDs, the median system lost 4.7% of franchised outlets in a year, the top decile lost 17.1% or more, and 35.0% of systems shrank. Systems franchising 35 years or more lost 4.8% of outlets a year against 8.5% for systems under 5 years, per our franchise closure rate study and the franchise failure rate review.
Which FDD items prove or disprove each claim?
Ten of the 23 FDD items required by 16 CFR 436.5 carry the evidence for the pros and cons above. Items 11, 12, 19, 20 and 21 test the advantages; Items 6, 7, 8, 17 and 22 price the disadvantages. Reading those ten in order takes one sitting and replaces most of the claims in marketing material.
- Item 6: royalty, ad fund and other fees. Add every percentage-of-sales line; the median total is 8%.
- Item 7: total startup investment. The median range in 259 FDDs ran from $265,372 to $573,000.
- Item 8: required suppliers and rebates. Check whether the franchisor or an affiliate earns revenue from your purchases.
- Item 11: training hours and who pays travel. Compare the hours with the 76-hour median.
- Item 12: protected territory and its carve-outs. Look for online sales and performance conditions.
- Item 17: renewal, transfer, non-compete, disputes. 88.4% of FDDs have a post-term non-compete, 86.0% of them for 2 years.
- Item 19: performance data, if any. 200 of 259 FDDs (77.2%) include one; read which outlets it covers.
- Item 20: openings, closures and transfers. Divide 3 years of exits by the starting outlet count.
- Item 21: franchisor financial statements. Check that the franchisor can fund the support it promises.
- Item 22: personal guaranty form. Check for a cap, a burn-off and whether a spouse must sign.
Where does the franchise trade-off favor you, by industry?
The brand advantage is largest in restaurants, hotels and real estate brokerage, and absent in fitness, where franchise units averaged 0.61 times the sales of independents in the 2017 Economic Census. The ratios below are our division of Census averages for franchise and non-franchise establishments in the same industry; above 1.00 means the franchise units sold more.
| Industry (2017) | Franchise vs independent average sales | Reading | Source |
|---|---|---|---|
| Offices of real estate agents and brokers | 1.94 times | Strong brand edge | Economic Census EC1700FRAN |
| Limited-service restaurants | 1.59 times | Strong brand edge | Economic Census EC1700FRAN |
| Hotels and motels | 1.54 times | Strong brand edge | Economic Census EC1700FRAN |
| Tax preparation services | 1.27 times | Moderate edge | Economic Census EC1700FRAN |
| Full-service restaurants | 1.26 times | Moderate edge | Economic Census EC1700FRAN |
| Beauty salons | 1.10 times | Small edge | Economic Census EC1700FRAN |
| Janitorial services | 0.99 times | No edge | Economic Census EC1700FRAN |
| Fitness and recreational sports centers | 0.61 times | Independents sold more | Economic Census EC1700FRAN |
The costs of the franchise model also differ by sector. Business services carry the highest median royalty at 8% but the lowest churn at 5.0%, while fitness pairs a 7% royalty with the highest median churn, 16.2% of outlets in one year. Lodging buyers wait longest: a median 18 to 24 months from signing to opening.
| Sector (FDDs 2025 to 2026) | Median royalty | Median one-year churn | Typical months to open (median high end) | Source |
|---|---|---|---|---|
| Business services | 8% | 5.0% | 3 | FDD Items 6, 11 and 20 |
| Senior and in-home care | 5% | 8.4% | 6 | FDD Items 6, 11 and 20 |
| Food and beverage | 5.5% | 10.3% | 11 | FDD Items 6, 11 and 20 |
| Home services | 6% | 11.0% | 3.9 | FDD Items 6, 11 and 20 |
| Lodging | 5.25% | 15.6% | 24 | FDD Items 6, 11 and 20 |
| Fitness | 7% | 16.2% | 12 | FDD Items 6, 11 and 20 |
Franchise or independent: which situation points which way?
Five checks settle most cases: whether you can accept an uncapped guarantee, whether your plan needs your own suppliers, how long the system has franchised, and whether your segment is restaurants and hotels, where the brand measurably lifts sales, or fitness, where it does not. The table holds the thresholds; the flowchart puts the same checks in the order a buyer usually meets them.
| If this describes you | What the data says | Next step |
|---|---|---|
| Can you sign a personal guarantee with no dollar cap? | No: 96.1% of FDDs set no cap. An independent start may fit better. | Ask the franchisor whether a cap or burn-off is negotiable; 3 of 247 forms have a cap |
| Does your plan rely on your own suppliers or menu? | Yes: 99.2% of FDDs restrict purchases. An independent start may fit better. | Read Item 8 for the restricted share; food and beverage FDDs restrict a median 90% of startup purchases |
| Is the system franchising under 5 years? | Yes: outlet losses ran 8.5% a year vs 4.8% at 35+ years. Ask for more validation calls. | Call former owners listed in Item 20, not only current ones |
| Is the segment restaurants or hotels? | Yes: franchise units out-sold independents in 2017. The brand edge is measurable. | Compare royalty plus fund (median 8%) with the sales edge in your segment |
| Is the segment fitness? | Yes: franchise units sold 0.61 times independents and churn ran 16.2%. Test Item 20 hard. | Divide 3 years of Item 20 exits by starting outlets before signing |
| Do you need an SBA loan for a new unit? | Franchise spread 2.25 vs 2.75 points, but startup charge-offs 11.3% vs 7.7% | Budget to the Item 7 high estimate, not the low one |
This page is general information, not legal, financial or investment advice. A franchise attorney can read the Item 17 table and guaranty for you; ask specifically whether the guaranty survives a sale, since 114 of 252 FDDs with a guarantee say nothing about it.
How we compiled this
We opened 7 primary documents in November 2026: two Census Bureau working papers, a 2024 journal abstract, the FTC staff Issue Spotlight, 16 CFR 436.5, Minn. Stat. 80C.14 and the Anytime Fitness FDD. Other figures come from our linked research reports, built from 259 Minnesota-filed FDDs issued 2025 to 2026 and SBA 7(a) FOIA data as of June 30, 2026. We excluded unsourced trade-press survival claims and every Item 19 figure.
Frequently asked questions
Is a franchise less risky than starting your own business?
Slightly, and mainly in year one. Census microdata on 2002 and 2007 startups found franchises 5.1 percentage points more likely to survive their first year, with no significant extra edge in year three. Older Census data on firms active in 1987 found franchises survived less often, 65.3% against 72.0%. The system you pick matters more: median annual outlet losses ranged from 5.0% to 16.2% by sector.
Is it easier to get a loan for a franchise?
Loans are priced slightly lower. From April to June 2026, franchise-coded SBA 7(a) loans carried a median 2.25 points over prime against 2.75 points for other 7(a) loans, per SBA FOIA data. Franchise loans were 13.8% of 7(a) loans and 21.8% of 7(a) dollars in FY2026 through June 30, 2026. Startup franchise loans from FY2010 to FY2019 were charged off more often, 11.3% against 7.7%.
Can you sell a franchise whenever you want?
You can sell, but the franchisor must approve the buyer and usually charges a fee. 253 of 259 FDDs issued 2025 to 2026 list a transfer fee in Item 6, with a median fixed fee of $10,000, and 34.7% add a broker or finder charge. Transfers were still the most common form of franchise turnover: 43.2% of 5,416 events in 220 systems.
Do franchise owners have to sign a personal guarantee?
Almost always. 252 of 259 FDDs issued 2025 to 2026 require or provide for a personal guarantee from the owners of the franchisee company, and 249 set no dollar cap. 92 FDDs (35.5%) also require spouses of owners to sign. Half of the guarantees run past the end of the agreement or until every obligation is met.
Do franchisees get an exclusive territory?
Rarely in the full sense. 221 of 259 FDDs print the federal sentence “You will not receive an exclusive territory” in Item 12, and 49 give no protected area at all. Where an area is protected, 92.9% let the franchisor sell online inside it, 32.9% exclude venues such as airports and stadiums, and 53.3% can be cut by a performance rule.
Do state laws protect franchisees from termination?
In 18 states and Puerto Rico, a franchise relationship law limits termination, and 16 of those 19 jurisdictions require good, reasonable or just cause. Minnesota requires 180 days notice before a nonrenewal under Minn. Stat. 80C.14. The other 32 states and DC have no general relationship law, so the agreement’s Item 17 terms govern.
Sources
- Lafontaine, Zapletal and Zhang, Brighter Prospects? Assessing the Franchise Advantage using Census Data, CES 17-21, U.S. Census Bureau, February 2017, accessed November 3, 2026.
- Bates, Firms Started as Franchises Have Lower Survival Rates than Independent Small Business Startups, CES 94-3, U.S. Census Bureau, 1994, accessed November 3, 2026.
- Bates, Survival Patterns Among Newcomers to Franchising, CES 97-5, U.S. Census Bureau, 1997, accessed October 3, 2026.
- Cotei and Farhat, Thinking about starting a franchise business? Think again, Journal of Entrepreneurial Finance 26(1), 2024, accessed November 3, 2026.
- 2017 Economic Census, Franchise Statistics (EC1700FRAN), U.S. Census Bureau, accessed October 4, 2026.
- SBA 7(a) and 504 FOIA loan data, U.S. Small Business Administration, data as of June 30, 2026, accessed October 2026.
- Issue Spotlight: Risks to Small Business Success in Franchising, Federal Trade Commission staff, July 2024, accessed November 3, 2026.
- 16 CFR 436.5, Disclosure items, via Legal Information Institute (eCFR returned a bot check), accessed November 3, 2026.
- Anytime Fitness Franchise Disclosure Document, issued March 31, 2026, as amended September 14, 2026, Item 12, Minnesota CARDS, accessed November 3, 2026.
- Minnesota Department of Commerce CARDS franchise registrations, 259 FDDs issued 2025 to 2026, accessed October 2026.
- Minnesota Statutes section 80C.14, Office of the Revisor of Statutes, accessed November 3, 2026.