Beauty Salon Franchise Statistics: Salons, Barbers, Nails, Spas and Weight Loss
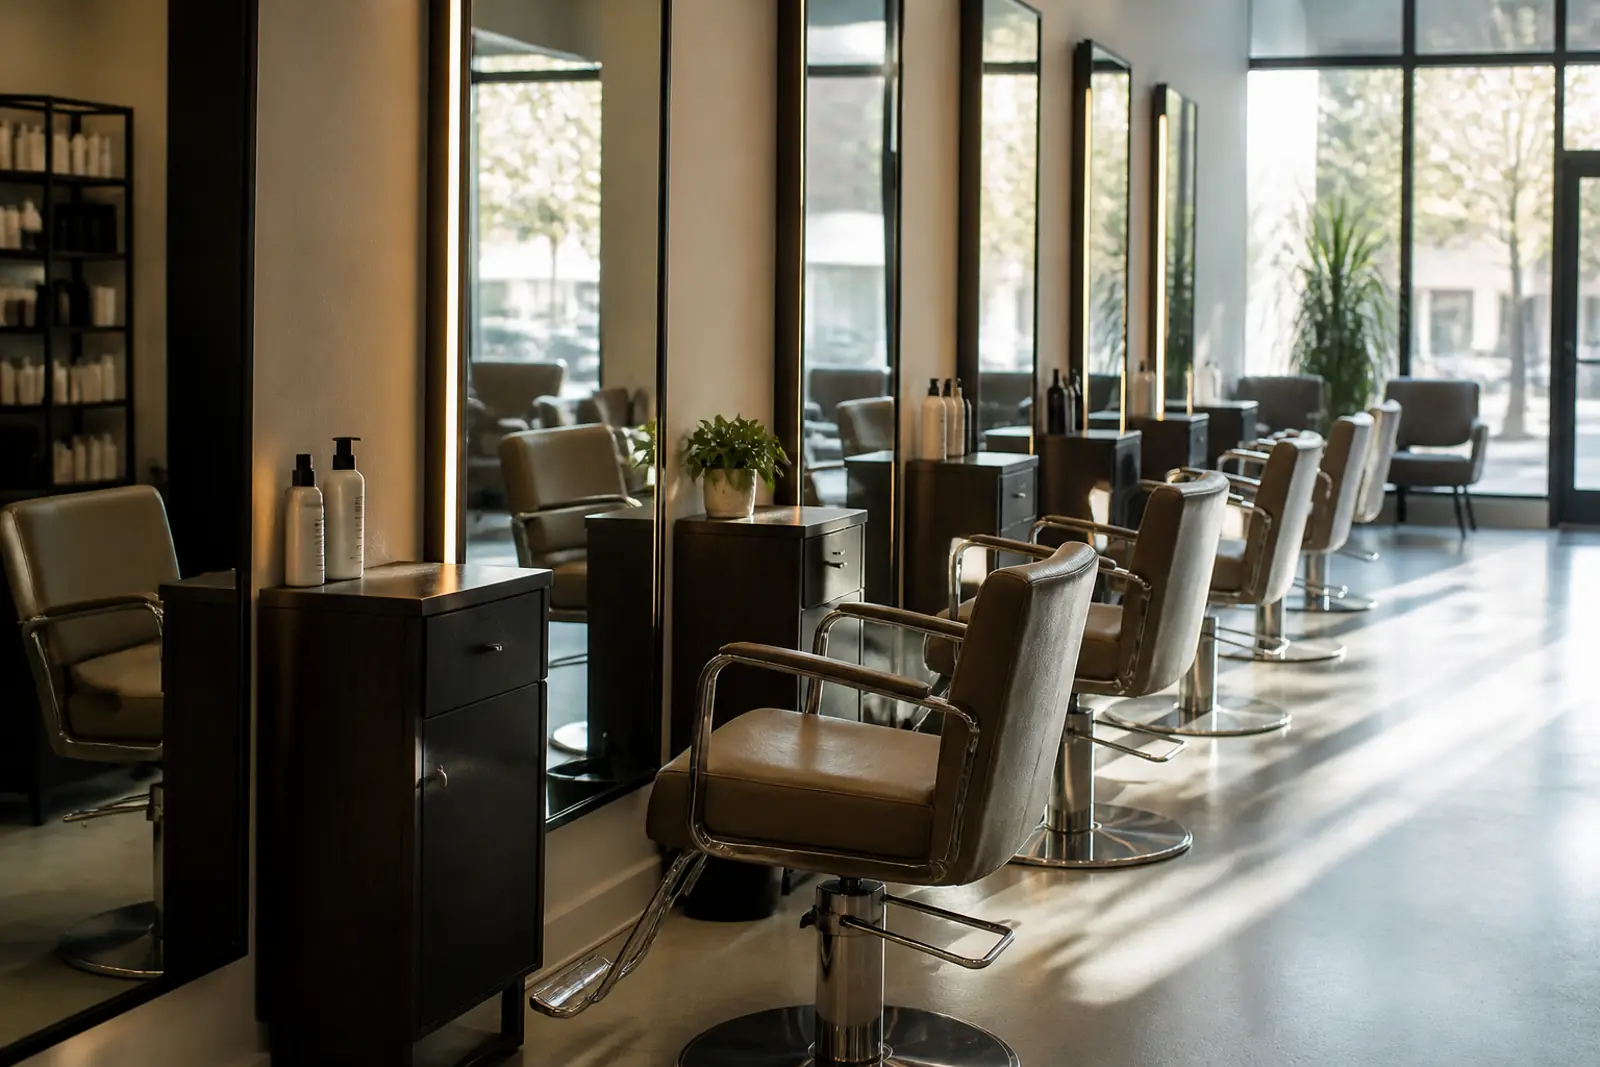
Beauty salon franchise statistics from the 2017 Economic Census, the latest U.S. count, show 21,462 franchise beauty salons, 27.2% of employer salons, while weight loss centers were the most franchised personal care industry at 49.8%. SBA approved 2,022 franchise-coded personal care loans from FY2020 to June 30, 2026 (median $350,000).
Beauty salon franchise statistics by industry
Summary. The table ranks the five U.S. personal care industries (NAICS 8121xx) on the latest Census franchise count (2017) and on SBA loans approved from FY2020 to June 30, 2026. Beauty salons have the most franchise units; weight loss centers have the highest franchised share; other personal care services (waxing, massage, tanning, day spas) draw the most franchise-coded SBA loans.
The 2017 Economic Census counted 28,596 franchise establishments across the five industries, 21.3% of 134,449 employer establishments (Census EC1700FRAN). That share is well above the 11.5% average for all industries in the 2017 franchise tabulation, and personal care held 5.7% of all 498,234 franchise establishments counted that year.
Two cautions apply to every column. The Census figures cover employer establishments only, and 2017 is the latest U.S. tabulation: the 2022 Economic Census asked the franchise question but its release schedule lists no U.S. franchise table (2022 release schedule). SBA counts depend on lenders entering a franchise code, which dipped while SBA did not publish its Franchise Directory (see the lending section).
| NAICS | Industry | Establishments, 2017 | Franchise establishments, 2017 | Franchised share, 2017 (%) | Franchisee-owned share of franchise units, 2017 (%) | Receipts per franchise establishment, 2017 ($) | Receipts per non-franchise establishment, 2017 ($) | Franchise to non-franchise size ratio, 2017 | SBA franchise-coded loans, FY2020 to FY2026 | Franchise-coded share of SBA loans, FY2020 to FY2026 (%) | Median franchise-coded SBA loan, FY2020 to FY2026 ($) |
|---|---|---|---|---|---|---|---|---|---|---|---|
| 812111 | Barber shops | 5,166 | 981 | 19 | 92 | 321,685 | 175,048 | 1.84 | 203 | 20.7 | 307,600 |
| 812112 | Beauty salons | 78,887 | 21,462 | 27.2 | 90.7 | 306,860 | 279,501 | 1.1 | 574 | 9.7 | 313,500 |
| 812113 | Nail salons | 24,931 | 379 | 1.5 | 71 | 289,332 | 249,651 | 1.16 | 59 | 3.5 | 328,000 |
| 812191 | Diet and weight reducing centers | 2,982 | 1,484 | 49.8 | 41.2 | 604,871 | 589,229 | 1.03 | 51 | 24.6 | 200,000 |
| 812199 | Other personal care services | 22,483 | 4,290 | 19.1 | 80.3 | 686,124 | 281,843 | 2.43 | 1,135 | 27.3 | 420,000 |
| 8121 | Personal care services, five industries combined | 134,449 | 28,596 | 21.3 | 86.4 | 379,499 | 273,233 | 1.39 | 2,022 | 15.6 | 350,000 |
Salons, barbers and nail salons: franchise counts and unit size
Summary. Beauty salons lead personal care franchising by count, but a franchise salon is a small business by franchise standards and only slightly larger than an independent employer salon. Barbers and other personal care show a wider franchise size gap; nail salons are barely franchised.
In 2017, 21,462 of 78,887 employer beauty salons (27.2%) were franchises (Census). Beauty salons ranked 6th of 268 industries by number of franchise establishments and held 4.3% of all franchise establishments. Franchisees owned 90.7% of franchise salons; franchisors owned 1,986.
Receipts per franchise salon averaged $306,860 in 2017, against $279,501 for a non-franchise employer salon, a ratio of 1.10. A franchise salon employed 6.3 paid workers against 5.2. Compared with franchising as a whole, the franchise salon is small: $306,860 is 8.8% of the $3,468,320 average per franchise establishment across all industries in the tabulation, and salons sit 9th from the bottom of 247 industries on receipts per franchise establishment.
Barber shops were 19.0% franchised (981 of 5,166), with franchise shops taking in $321,685 against $175,048 (ratio 1.84) and employing 7.3 workers against 3.3. Nail salons were 1.5% franchised (379 of 24,931). Other personal care services were 19.1% franchised, and franchise units there were the largest in personal care at $686,124 per establishment, 2.43 times non-franchise units. The same comparison across all industries is in franchise vs independent business.
Franchise share trend, 2007 to 2017, and the 2017 series break
Summary. Between 2007 and 2012, when the method was stable, franchise shares in personal care moved little except in weight loss, which fell. The 2017 figures sit on a new method and are higher in almost every industry.
Beauty salons were 8.0% franchised in 2007 (Census 2007) and 8.3% in 2012 (Census 2012). Barber shops went from 6.6% to 8.0%, other personal care from 9.6% to 12.4% and nail salons from 1.0% to 2.2%. Weight loss centers dropped from 58.3% to 53.3% and then to 49.8% in 2017, the only personal care industry whose share fell in both intervals.
Response coverage matters for the older years: in 2012, establishments answering the franchise question accounted for 73.0% of beauty salon sales and 48.2% of weight loss center sales.
| NAICS | Industry | Franchise establishments, 2007 | Franchised share, 2007 (%) | Franchise establishments, 2012 | Franchised share, 2012 (%) | Franchise establishments, 2017 | Franchised share, 2017 (%) | Franchisor-owned share of franchise units, 2017 (%) |
|---|---|---|---|---|---|---|---|---|
| 812111 | Barber shops | 285 | 6.6 | 304 | 8 | 981 | 19 | 8 |
| 812112 | Beauty salons | 6,502 | 8 | 6,326 | 8.3 | 21,462 | 27.2 | 9.3 |
| 812113 | Nail salons | 78 | 1 | 379 | 2.2 | 379 | 1.5 | 29 |
| 812191 | Diet and weight reducing centers | 1,875 | 58.3 | 1,697 | 53.3 | 1,484 | 49.8 | 58.8 |
| 812199 | Other personal care services | 1,487 | 9.6 | 2,144 | 12.4 | 4,290 | 19.1 | 19.7 |
Weight loss centers: the most franchised corner of personal care
Summary. On share, weight loss is the most franchised corner of personal care. It is also the corner where franchisors own most units and where employment has shrunk fastest.
In 2017, 1,484 of 2,982 diet and weight reducing centers (49.8%) were franchises, 6th of 247 U.S. industries with 1,000 or more establishments (Census). Franchise units took 50.4% of the industry’s receipts and 52.6% of its employees. Unlike the rest of personal care, most franchise units were company-run: franchisors owned 872 (58.8%) and franchisees 612.
Since then the industry has contracted. Private employment in NAICS 812191 fell from 22,085 in 2019 to 10,279 in 2025 (minus 53.5%) and establishments from 3,011 to 2,390 (BLS QCEW). SBA lending is thin: 51 franchise-coded loans from FY2020 to June 30, 2026. The NAICS code covers non-medical programs only, so medically supervised weight loss clinics are counted in health care and are not in these figures.
Firms, solo operators and why the franchise share depends on the count
Summary. How franchised hair salons look depends on what is counted: 27.2% of employer establishments, about 5.5% of employer firms, and under 3% once solo salon businesses are added.
The Annual Business Survey counts firms, not locations. In 2023 (2024 ABS), 2,981 of 54,514 responding personal care employer firms (5.5%, standard error 0.5 points) operated all or part of the business as a franchise (Census ABS), against 4.7% for all sectors. Those franchise firms held 18.5% of employees (standard error 4.9 points) and 14.7% of receipts (standard error 3.8 points), 3.4 times their share of firms on employees, consistent with multi-unit franchisees. The personal care franchise share of firms was 7.6% in 2021 and 6.6% in 2022; the 2020 figure was withheld.
Most salon businesses have no employees. The Census counted 732,946 nonemployer beauty salons in 2017 (Nonemployer Statistics 2017) and 867,242 in 2024 (Nonemployer Statistics 2024), average receipts $30,832 in 2024. Franchise salons were 2.6% of employer salons plus nonemployer salon businesses in 2017, a floor because nonemployer franchise status is not collected. Employer salons have lost workers: private beauty salon employment fell 14.2% from 2019 to 2025 while nail salons gained 36.8% and other personal care 27.0%.
| NAICS | Industry | Private establishments, 2019 | Private establishments, 2025 | Private employment, 2019 | Private employment, 2025 | Employment change, 2019 to 2025 (%) | Nonemployer businesses, 2024 |
|---|---|---|---|---|---|---|---|
| 812111 | Barber shops | 5,926 | 8,547 | 30,936 | 35,340 | 14.2 | 154,456 |
| 812112 | Beauty salons | 74,418 | 77,449 | 421,585 | 361,683 | -14.2 | 867,242 |
| 812113 | Nail salons | 25,908 | 34,300 | 114,129 | 156,148 | 36.8 | 318,382 |
| 812191 | Diet and weight reducing centers | 3,011 | 2,390 | 22,085 | 10,279 | -53.5 | in 81219: 199,632 |
| 812199 | Other personal care services | 22,213 | 33,417 | 147,940 | 187,817 | 27 | in 81219: 199,632 |
SBA lending to personal care franchises, FY2010 to FY2026
Summary. SBA franchise lending in personal care is concentrated in other personal care services, skews to startups, and has grown in loan size; the franchise-coded share dipped during the Directory gap and recovered.
From FY2020 to June 30, 2026, SBA approved 12,952 7(a) and 504 loans to the five personal care industries, and 2,022 (15.6%) carried a franchise code, worth $925.9 million (SBA FOIA). Other personal care services had 1,135 franchise-coded loans (27.3% of its SBA loans, 9th of 538 NAICS codes by franchise loan count), beauty salons 574 (9.7%, 17th), barber shops 203 (20.7%), nail salons 59 and weight loss centers 51. Personal care was 4.0% of all 51,043 franchise-coded SBA loans in the period. See SBA franchise loans for the program-wide picture.
The median franchise-coded personal care loan was $350,000 against $100,000 for non-franchise personal care loans and $407,000 for franchise-coded loans in all industries. It rose from $240,000 across FY2010 to FY2019 to $450,250 in FY2026 to date. Startups took 70.6% of franchise-coded personal care 7(a) loans against 16.4% of non-franchise ones.
| Fiscal year | Personal care SBA loans | Franchise-coded | Franchise-coded share (%) | All industries franchise-coded share (%) | Median franchise-coded loan ($) | Beauty salons, franchise-coded | Other personal care, franchise-coded |
|---|---|---|---|---|---|---|---|
| FY2010 | 1,003 | 108 | 10.8 | 6 | 175,000 | 37 | 30 |
| FY2011 | 1,183 | 99 | 8.4 | 5.7 | 172,200 | 34 | 40 |
| FY2012 | 1,153 | 155 | 13.4 | 6.6 | 180,800 | 57 | 39 |
| FY2013 | 1,316 | 176 | 13.4 | 7.4 | 200,000 | 60 | 57 |
| FY2014 | 1,456 | 311 | 21.4 | 9.3 | 256,000 | 139 | 125 |
| FY2015 | 1,754 | 469 | 26.7 | 9.5 | 256,800 | 179 | 228 |
| FY2016 | 1,795 | 458 | 25.5 | 9.4 | 236,250 | 231 | 177 |
| FY2017 | 1,856 | 439 | 23.7 | 9.5 | 225,500 | 221 | 174 |
| FY2018 | 1,775 | 463 | 26.1 | 11.5 | 250,000 | 209 | 184 |
| FY2019 | 1,619 | 446 | 27.5 | 12.9 | 284,500 | 209 | 165 |
| FY2020 | 1,157 | 273 | 23.6 | 13 | 310,000 | 119 | 97 |
| FY2021 | 1,219 | 271 | 22.2 | 14.6 | 335,000 | 80 | 137 |
| FY2022 | 1,466 | 245 | 16.7 | 13.3 | 310,000 | 70 | 126 |
| FY2023 | 2,010 | 322 | 16 | 12.6 | 349,650 | 88 | 195 |
| FY2024 | 2,600 | 310 | 11.9 | 8.3 | 354,750 | 69 | 225 |
| FY2025 | 2,964 | 351 | 11.8 | 9.1 | 434,000 | 90 | 205 |
| FY2026 (to Jun 30) | 1,536 | 250 | 16.3 | 13.4 | 450,250 | 58 | 150 |
What personal care FDDs charge and disclose
Summary. Personal care FDDs sit near the middle of the franchise sample on cost and fees, and above it on manager-run permission and transfers.
The site’s sample of 259 Minnesota FDDs includes 18 personal services and beauty brands (hair, barber, nail, waxing, massage, facial, tanning, med spa, body sculpting and similar), issued between 2025-03-27 and 2026-08-18. Their median Item 7 estimate runs from $301,896 to $603,996, against $265,372 to $573,000 for all 259 (Item 7 data); 8th of 14 sectors on the high end. The median standard royalty is 6.0% and the median brand fund contribution 2.0%, both equal to the full sample (fee data). The median initial fee is $49,750 at the high end and the median transfer fee $10,000. Item 7 assumes leased premises in 88.9% of the 18.
Item 12 grants a protected area in 14 of 18 (77.8%, all sample 73.7%). In the latest fiscal year reported in Item 20, exits equaled 6.3% of start-of-year franchised outlets (all sample 6.2%) and transfers 5.8% (all sample 4.7%, 3rd of 14 sectors), across 4,694 outlets in 14 systems with a usable base. Item 19 financial performance representations appear in 83.3% of the personal care FDDs; this report does not use their figures. For cost context see franchise costs.
| Sector | FDDs | Median Item 7 low ($) | Median Item 7 high ($) | Median royalty (%) | Manager may run the unit (% of FDDs) | Protected area in Item 12 (% of FDDs) | Exits, latest year (% of franchised outlets) | Transfers, latest year (% of franchised outlets) |
|---|---|---|---|---|---|---|---|---|
| Personal services and beauty | 18 | 301,896 | 603,996 | 6 | 88.9 | 77.8 | 6.3 | 5.8 |
| Automotive | 17 | 265,384 | 940,050 | 6 | 58.8 | 76.5 | 3.8 | 4.1 |
| Business services | 18 | 58,855 | 125,627 | 8 | 55.6 | 38.9 | 5.8 | 1.3 |
| Cleaning and restoration | 18 | 164,105 | 258,400 | 7 | 61.1 | 77.8 | 5.7 | 2.7 |
| Education and children | 18 | 195,004 | 374,128 | 7 | 66.7 | 88.9 | 4.5 | 4 |
| Entertainment and recreation | 18 | 850,375 | 2,104,350 | 7 | 88.9 | 94.4 | 4 | 5.1 |
| Fitness | 18 | 319,510 | 746,562 | 7 | 94.4 | 100 | 7.5 | 8.6 |
| Food and beverage | 27 | 484,050 | 959,374 | 5.5 | 66.7 | 51.9 | 8.8 | 7.2 |
| Health and wellness | 17 | 347,050 | 635,078 | 7 | 88.2 | 88.2 | 8.6 | 3.4 |
| Home services | 18 | 140,475 | 257,325 | 6 | 66.7 | 94.4 | 9.5 | 3.7 |
| Lodging | 18 | 9,162,958 | 23,895,500 | 5.2 | 100 | 11.1 | 5.3 | 4.5 |
| Pet services | 18 | 226,088 | 572,300 | 7 | 66.7 | 100 | 5.4 | 4.7 |
| Retail | 18 | 242,750 | 661,575 | 5.4 | 55.6 | 50 | 5.1 | 3.2 |
| Senior and in-home care | 18 | 101,800 | 182,425 | 5 | 50 | 94.4 | 5.2 | 3.9 |
| All 259 sample FDDs | 259 | 265,372 | 573,000 | 6 | 71.8 | 73.7 | 6.2 | 4.7 |
Manager-run models in Item 15
Summary. On owner role, personal care FDDs lean toward manager-run units more than most sectors. They do not use semi-absentee language, and a third still require the owner to stay involved.
FTC Rule Item 15 must state whether the franchisee has to take part personally in running the business (16 CFR 436.5(o)). In the 18 personal services and beauty FDDs, 16 (88.9%) let a manager run the unit, against 71.8% of all 259 sampled FDDs, 3rd of 14 sectors (tied with entertainment) (Item 15 data). Ten of the 16 attach conditions to the manager (training, approval, or similar) and six require the owner to stay involved while a manager runs daily operations. Only 1 requires a full-time owner (5.6%, against 23.2% of all sampled FDDs).
None of the 18 FDDs uses the words semi-absentee, absentee, executive model or passive owner anywhere in the document. A manager-run permission in Item 15 is a legal allowance, not a statement about how much time an owner will spend. The cross-sector picture is in semi-absentee franchises.
| Item 15 rule | Personal services FDDs | Personal services (%) | All sample FDDs | All sample (%) |
|---|---|---|---|---|
| Manager may run it; conditions on the manager | 10 | 55.6 | 123 | 47.5 |
| Manager may run it; owner must stay involved | 6 | 33.3 | 61 | 23.6 |
| Manager may run it; no conditions stated | 0 | 0 | 2 | 0.8 |
| Owner must take part, not full time | 1 | 5.6 | 13 | 5 |
| Owner must work full time | 1 | 5.6 | 60 | 23.2 |
Suite and membership models in the FDDs
Summary. Two formats show up in current personal care FDDs: membership pricing inside service concepts, and salon suites that rent space to independent professionals instead of employing them.
Ten of the 18 personal services and beauty FDDs describe a customer membership program, plan or agreement (for services such as massage, facials, waxing, blowouts, tanning or spa treatments). The sample contains no salon suite brand, so a Minnesota CARDS search found three salon suite systems with a 2025 or 2026 FDD. Each describes licensing or subleasing furnished suites to independent salon professionals who serve their own clients.
The three suite FDDs estimate $676,081 to $1,217,272 (FDD issued September 19, 2025), $675,106 to $1,678,095 (FDD issued May 1, 2025) and $922,528 to $2,274,038 (FDD issued May 5, 2026) to open one location. Royalties are set on space or revenue: one charges $0.34 per square foot leased, per month; the other two charge the greater of $1,000 or 5.5% of gross revenues (one after reduced rates in the first 12 months). Item 15 differs too: one requires full-time on-premises supervision by the owner, the other two allow a designated or approved manager.
Original analysis: how we calculated it
Franchised share by personal care industry, 2007 to 2017
- Formula
franchise establishments / all establishments x 100, by 6-digit NAICS and Census year- Inputs
- D013, D080, D119, D037, D092, D131, D160
- Result
- Beauty salons 8.0% (2007), 8.3% (2012), 27.2% (2017); weight loss 58.3%, 53.3%, 49.8%; 2017 is a series break (+18.9 points for salons)
- Limitations
- 2017 wording and machine-learning review raised counts by 22% to 42% (CES-WP-19-20); 2022 not tabulated; employer establishments only.
Franchise vs independent size
- Formula
(RCPTOT x 1,000 / ESTAB) for franchise units divided by the same for non-franchise units; franchise salon receipts / all-industry receipts per franchise establishment- Inputs
- D018, D006, D054, D154, D155
- Result
- Salons 1.10, barbers 1.84, other personal care 2.43; a franchise salon is 8.8% of the average franchise establishment, 9 of 247 from the bottom
- Limitations
- Revenue, not profit; non-franchise includes blank answers; 2017 only.
SBA franchise lending by sub-sector and year
- Formula
count, sum and median of GrossApproval where FranchiseCode is not blank, by NAICS and fiscal year- Inputs
- D256, D242, D200, D258, D260, D444
- Result
- 2,022 franchise-coded loans FY2020 to June 30, 2026 (15.6%), 1,135 in other personal care; median $350,000 vs $100,000; coded share 10.9% during the Directory gap
- Limitations
- Lender-entered code; Directory gap undercounts FY2024 and FY2025; FY2026 partial.
FDD slice vs other sectors
- Formula
median of brand values (Item 7, royalty); share of FDDs (Items 12, 15, 19); pooled Item 20 rates- Inputs
- D569, D449, D570, D576, D456, D612
- Result
- Item 7 median high $603,996 (8th of 14 sectors); royalty 6.0% (sample 6.0%); transfers 5.8% vs 4.7% (3rd of 14)
- Limitations
- 18-brand sample; medians hide spread; Item 20 rates for one fiscal year.
Owner participation in personal care FDDs (Item 15)
- Formula
FDDs per Item 15 category / FDDs in group x 100- Inputs
- D572, D452, F149, D619, D620, F159
- Result
- 88.9% allow a manager (sample 71.8%); 6 of 18 keep the owner involved; full-time owner 5.6% vs 23.2%; 0 use semi-absentee wording
- Limitations
- Legal permission, not observed owner hours; 18 FDDs.
Three lenses on how franchised salons are
- Formula
franchise establishments / (employer establishments + nonemployer businesses); ABS franchise firms / responding firms; ABS employee share / firm share- Inputs
- D182, F092, D169, D013
- Result
- 27.2% of employer salons (2017), 5.5% of personal care employer firms (2023), 2.6% of all salon businesses (2017 floor); franchise firms hold 3.4 times their firm share of employees
- Limitations
- Different units and years; nonemployer franchise status unknown; ABS standard errors.
Where the data stops
Summary. The Census franchise count is nine years old, the SBA code is lender-entered, and the FDD slice is a sample.
- 2017 is the latest U.S. Economic Census franchise tabulation; 2022 was collected but not tabulated for the U.S., so no newer establishment count exists.
- 2017 is not comparable with 2007 and 2012 because the question and review method changed.
- Non-franchise establishments include those that left the franchise question blank, which pulls the franchise share down in every year.
- ABS shares are for responding employer firms; standard errors on employment and receipts shares are wide.
- Nonemployer and QCEW counts carry no franchise flag; they size the field, they do not measure franchising.
- SBA franchise coding depends on the lender and on the Directory; FY2026 is a partial year.
- The FDD slice is 18 brands chosen by the site’s stratified sample, plus three suite FDDs found by name search; it is not a census of personal care franchisors.
This report is research, not investment, legal, tax or financial advice. It makes no earnings claims; receipts are revenue, not profit, and Item 19 figures are not used.
At a glance
- Hair salons are franchised at scale: the 2017 Economic Census counted 21,462 franchise beauty salons in the U.S., 27.2% of 78,887 employer salons and the 6th-largest franchise industry by establishment count (of 268).
- Franchise salons are small units by franchise standards: receipts averaged $306,860 per franchise salon in 2017, 8.8% of the $3,468,320 average across all franchise establishments, yet only 1.10 times the non-franchise employer salon.
- Weight loss centers are the most franchised personal care corner (49.8% of establishments in 2017, 6th of 247 industries), but 58.8% of those franchise units were franchisor-owned and private employment in the industry fell 53.5% from 2019 to 2025 (BLS QCEW).
- Counted against all salon businesses, franchising is thin: franchise salons were 2.6% of employer salons plus nonemployer salon businesses in 2017, and the Census counted 867,242 nonemployer beauty salons in 2024.
- SBA lending: 2,022 of 12,952 personal care SBA loans (15.6%) were franchise-coded from FY2020 to June 30, 2026, $925.9 million in total, with a median of $350,000 against $100,000 for non-franchise loans.
- Other personal care (waxing, massage, tanning, day spas) took 1,135 of those franchise-coded loans, nearly twice the 574 for beauty salons; weight loss centers had 51.
- In 18 personal services and beauty FDDs issued 2025 to 2026, 16 let a manager run the unit and 1 requires a full-time owner, but none uses semi-absentee or absentee wording; the median Item 7 range is $301,896 to $603,996.
Key findings
- 21,462 of 78,887 U.S. employer beauty salons (27.2%) were franchise establishments in 2017; 90.7% of those franchise salons were franchisee-owned. Census EC1700FRAN
- Diet and weight reducing centers had the highest franchise share in U.S. personal care in 2017: 1,484 of 2,982 establishments (49.8%), 6th of 247 industries with 1,000 or more establishments. Census EC1700FRAN
- Franchisor-owned units made up 58.8% of franchise weight loss centers in 2017 (872 of 1,484), against 9.3% of franchise beauty salons (1,986 of 21,462). Census EC1700FRAN
- Barber shops were 19.0% franchised (981 of 5,166), other personal care services 19.1% (4,290 of 22,483) and nail salons 1.5% (379 of 24,931) in 2017. Census EC1700FRAN
- Receipts per franchise beauty salon were $306,860 in 2017 against $279,501 per non-franchise employer salon (ratio 1.10), and 9th smallest of 247 industries on receipts per franchise establishment. Census EC1700FRAN
- Franchise units in other personal care services took in $686,124 per establishment in 2017, 2.43 times the $281,843 of non-franchise units. Census EC1700FRAN
- The beauty salon franchise share was 8.0% in 2007 and 8.3% in 2012 before 27.2% in 2017; Census research shows the 2017 review method raised franchise counts by 22% to 42%, so the jump is not a trend. Census EC files and CES-WP-19-20
- Among responding U.S. employer firms in personal care services (NAICS 8121), 5.5% operated as franchises in 2023 (2024 ABS), but those firms held 18.5% of employees. Census ABS AB2300CSCB01
- The Census counted 867,242 nonemployer beauty salon businesses in 2024, 11.2 for every private employer salon establishment counted by BLS in 2025. Census Nonemployer Statistics 2024
- Private beauty salon employment fell from 421,585 in 2019 to 361,683 in 2025 (minus 14.2%) while nail salon employment rose 36.8%. BLS QCEW
- Personal care received 2,022 franchise-coded SBA 7(a) and 504 loans worth $925.9 million from FY2020 to June 30, 2026, 4.0% of all 51,043 franchise-coded SBA loans. SBA FOIA, as of 2026-06-30
- Startups took 70.6% of franchise-coded personal care 7(a) loans from FY2020 to June 30, 2026, against 16.4% of non-franchise personal care 7(a) loans. SBA FOIA, as of 2026-06-30
- The franchise-coded share of personal care SBA loans fell from 16.2% (Oct 2021 to May 10, 2023) to 10.9% (Oct 2023 to Feb 2025) while SBA did not publish its Franchise Directory, then returned to 15.8% after June 2025. SBA FOIA, as of 2026-06-30
- In 18 personal services and beauty FDDs issued 2025 to 2026, 88.9% let a manager run the unit against 71.8% of all 259 sampled FDDs, and the median royalty was 6.0%, the same as the full sample. Franchise Consultants and Brokers FDD datasets
- Three salon suite FDDs filed in Minnesota (issued 2025 to 2026) estimate $675,106 to $2,274,038 to open one location, at the low and high ends across the three. Minnesota CARDS FDDs
What's new
- 2026-10-14: SBA’s FOIA loan files are still dated June 30, 2026 (SBA FOIA data); FY2026 figures here run from the first approval on 2025-11-13 to June 30, 2026. In that partial year 250 of 1,536 personal care SBA loans (16.3%) were franchise-coded, median $450,250.
- 2026-10-09: the current SBA Franchise Directory file is dated October 9, 2026 (SBA); the Directory returned under SOP 50 10 8 (effective June 1, 2025), and SOP 50 10 8.1 took effect October 1, 2026 (SOP 50 10 version list).
- 2026-09-29: Census released Nonemployer Statistics 2024 (Census), counting 867,242 nonemployer beauty salon businesses.
- 2025 to 2026: the 18 personal services and beauty FDDs analyzed were issued between 2025-03-27 and 2026-08-18, 9 of them in 2026; the newest salon suite FDD found in Minnesota was issued May 5, 2026.
- 2026-12-03 (scheduled): the 2024 Annual Business Survey (Census release calendar) will update the personal care franchise share of firms. No 2022 Economic Census franchise table exists for the U.S. (2022 release schedule).
Questions people ask
How many hair salons are franchises?
The latest Census count is for 2017: 21,462 of 78,887 U.S. employer beauty salons (27.2%) were franchise establishments, plus 981 of 5,166 barber shops (19.0%) (Census EC1700FRAN). No newer U.S. count exists because the 2022 Economic Census franchise data were not tabulated. Most salon businesses have no employees: the Census counted 867,242 nonemployer beauty salons in 2024.
How much does a salon franchise cost?
In 18 personal services and beauty FDDs issued 2025 to 2026, the median Item 7 estimate runs from $301,896 to $603,996, and the median initial fee is $49,750 at the high end. Three salon suite FDDs estimate $675,106 to $2,274,038 across their low and high ends. The SBA median for a franchise-coded personal care loan was $350,000 (FY2020 to June 30, 2026). Check each brand’s Item 7; see franchise initial investment.
Are salon franchises semi-absentee?
Most allow it on paper: 16 of 18 personal services and beauty FDDs (88.9%) let a manager run the unit in Item 15, against 71.8% of all 259 sampled FDDs (Item 15 data). Six of the 16 still require the owner to stay involved, and none of the 18 uses the term semi-absentee.
What is a salon suite franchise?
A salon suite franchisee leases a commercial space, builds private furnished suites and licenses or subleases them to independent stylists and other beauty professionals who serve their own clients. In three Minnesota FDDs issued 2025 to 2026 (example FDD), opening one location was estimated at $675,106 to $2,274,038, with royalties based on square footage or 5.5% of gross revenues.
Can you get an SBA loan for a salon franchise?
Yes. SBA records show 574 franchise-coded 7(a) and 504 loans to beauty salons and 1,135 to other personal care businesses from FY2020 to June 30, 2026 (SBA FOIA). The median franchise-coded beauty salon loan was $313,500. The brand must be eligible under SBA rules; the SBA Franchise Directory lists eligible brands.
Frequently asked questions
What share of U.S. beauty salons are franchises?
27.2% of employer beauty salons in 2017 (21,462 of 78,887), according to the 2017 Economic Census, the latest U.S. count. Counting nonemployer salon businesses as well, franchise salons were 2.6% of the total in 2017.
Which personal care industry is the most franchised?
Diet and weight reducing centers: 49.8% of establishments were franchises in 2017 (1,484 of 2,982), 6th of 247 U.S. industries with 1,000 or more establishments (Census EC1700FRAN).
Are franchise salons bigger than independent salons?
Slightly. Receipts per franchise beauty salon averaged $306,860 in 2017 against $279,501 per non-franchise employer salon (ratio 1.10). Franchise barber shops were 1.84 times non-franchise ones and franchise units in other personal care 2.43 times (Census EC1700FRAN).
How many nail salons are franchised?
Very few: 379 of 24,931 U.S. employer nail salons (1.5%) were franchises in 2017, and SBA recorded 59 franchise-coded nail salon loans from FY2020 to June 30, 2026.
Is there newer Census data than 2017 on salon franchises?
Not for establishments. The 2022 Economic Census release schedule has no U.S. franchise table. The Annual Business Survey gives a firm-level share for personal care services: 5.5% of responding employer firms in 2023 (2024 ABS); the 2024 data are scheduled for December 3, 2026.
Who owns franchise salons, franchisees or franchisors?
Franchisees: 90.7% of franchise beauty salons and 92.0% of franchise barber shops were franchisee-owned in 2017. Weight loss is the exception, with 58.8% of franchise centers franchisor-owned (Census EC1700FRAN).
How much SBA money went to personal care franchises?
$925.9 million across 2,022 franchise-coded SBA 7(a) and 504 loans from FY2020 to June 30, 2026, 4.0% of all franchise-coded SBA loans by count (SBA FOIA, as of 2026-06-30).
What royalty do salon and beauty franchises charge?
The median standard royalty in 18 personal services and beauty FDDs issued 2025 to 2026 is 6.0% of sales, with a 2.0% median brand fund contribution; both match the 259-FDD sample. Salon suite FDDs can charge per square foot instead.
How many salon franchise outlets close each year?
In the latest fiscal year shown in Item 20 of 14 personal services FDDs, exits (terminations, non-renewals, reacquisitions and closures) equaled 6.3% of start-of-year franchised outlets, against 6.2% for the full sample; transfers equaled 5.8%.
Is salon employment growing?
Not at employer salons: private beauty salon employment fell from 421,585 in 2019 to 361,683 in 2025 (minus 14.2%, BLS QCEW). Nail salons grew 36.8% and other personal care 27.0% over the same years.
For journalists
Most quotable statistics
In 2017, 27.2% of U.S. employer beauty salons (21,462 of 78,887) were franchises, the latest Census count.
U.S. Census Bureau, EC1700FRANDiet and weight reducing centers were the most franchised U.S. personal care industry in 2017, at 49.8% of establishments.
U.S. Census Bureau, EC1700FRANA U.S. franchise beauty salon took in $306,860 on average in 2017, 8.8% of the average across all franchise establishments.
U.S. Census Bureau, EC1700FRANFrom FY2020 to June 30, 2026, the median franchise-coded SBA loan to a U.S. personal care business was $350,000, against $100,000 for non-franchise loans.
SBA 7(a) and 504 FOIAPrivate employment at U.S. diet and weight reducing centers fell 53.5% from 2019 to 2025.
BLS QCEW16 of 18 personal services and beauty FDDs issued in 2025 and 2026 let a manager run the unit; none uses the word semi-absentee.
Franchise Consultants and Brokers FDD datasets
If you cite only a few, cite these
- 27.2% of U.S. employer beauty salons were franchises in 2017 (Census EC1700FRAN). source
- Weight loss centers: 49.8% franchised in 2017, 58.8% of those units franchisor-owned (Census EC1700FRAN). source
- 2,022 franchise-coded SBA loans to personal care, $925.9 million, FY2020 to June 30, 2026 (SBA FOIA). source
Press summary and suggested headlines
Hair salons are among the most franchised small businesses in the United States by count, but franchise salons are small units, according to an analysis of Census, BLS, SBA and franchise disclosure data by Franchise Consultants and Brokers. The 2017 Economic Census, still the latest U.S. count, found 21,462 franchise beauty salons, 27.2% of employer salons, taking in $306,860 each on average, 8.8% of the average franchise establishment. Weight loss centers were the most franchised personal care industry at 49.8%, though franchisors owned 58.8% of those units and the industry's private employment fell 53.5% from 2019 to 2025. SBA approved 2,022 franchise-coded personal care loans worth $925.9 million from FY2020 to June 30, 2026, at a median of $350,000. In 18 personal services and beauty FDDs issued in 2025 and 2026, 16 let a manager run the unit, yet none uses the term semi-absentee. Data tables are free to reuse under CC BY 4.0.
Suggested headlines
- Census: More than 1 in 4 employer hair salons were franchises in 2017
- Weight loss centers are the most franchised corner of personal care, and the fastest shrinking
- Franchise salons take in $306,860 a year on average, a fraction of the typical franchise unit
- SBA backed $925.9 million in personal care franchise loans since FY2020
- 16 of 18 beauty franchise FDDs let a manager run the salon
Methodology
Sources and selection. Federal statistical files first: the Economic Census franchise tabulations for 2007, 2012 and 2017 (Census bulk files), the Annual Business Survey company summary files for 2019 to 2023, Nonemployer Statistics for 2017 and 2024, and BLS QCEW annual averages for 2017, 2019 and 2025. SBA 7(a) and 504 FOIA files as of June 30, 2026 supply loans; they were read with an explicit column list that excludes borrower names and addresses. FDD data come from the site’s published datasets for its 259-brand Minnesota sample (fees, Item 7, Item 12, Item 15, Item 19, Item 20) and from the 18 personal services FDDs and three salon suite FDDs downloaded from Minnesota CARDS. Market research estimates and franchisor marketing counts were excluded (see excluded.md).
Definitions and conflicts. Personal care = NAICS 812111, 812112, 812113, 812191 and 812199. Franchised share = franchise establishments divided by all establishments; non-franchise = all minus franchise. Census establishments, ABS firms and nonemployer businesses are different units and are never added except in the stated floor calculation; each comparison names its years. Where 2017 and earlier Census years conflict, 2017 is treated as a new level because of the method change documented in CES-WP-19-20. SBA franchise-coded = FranchiseCode not blank; FY2026 runs to June 30, 2026. FDD medians are of brand values; exit and transfer rates are pooled across brands.
Reproducibility. scripts/00_fetch.sh and 00_fetch_web.py download inputs; 01 to 05 compute Census, ABS, context, SBA and FDD figures; 06 finds and downloads suite FDDs; 07 writes factsheet.csv; 08 the tables; 09 report.json; 10_verify.py checks every number against the factsheet. Industries are ranked; brands are not. Not investment, legal, tax or financial advice. Last updated 2026-10-14.
Sources and source quality
Tier 1: primary and government sources (27)
- 16 CFR 436.5, Disclosure items (FTC Franchise Rule), eCFR as of 2026-10-01, eCFR (National Archives) (accessed 2026-10-14)
- 2007 Economic Census, Franchise Status (EC0700CFRA1), bulk file, U.S. Census Bureau (accessed 2026-10-14)
- 2012 Economic Census, Franchise Status (EC1200CFRA1), bulk file, U.S. Census Bureau (accessed 2026-10-14)
- 2017 Economic Census, Franchise Status for the U.S. (EC1700FRAN), bulk file, U.S. Census Bureau (accessed 2026-10-14)
- 2017 NAICS descriptions file, U.S. Census Bureau (accessed 2026-10-14)
- 2017 NAICS index file, U.S. Census Bureau (accessed 2026-10-14)
- 2022 Economic Census data release schedule, U.S. Census Bureau (accessed 2026-10-14)
- Affiliation and Lending Criteria for the SBA Business Loan Programs, 88 FR 21074 (April 10, 2023), Federal Register (GovInfo) (accessed 2026-10-14)
- Annual Business Survey 2019 (2020 ABS), Company Summary (AB1900CSCB01), bulk file, U.S. Census Bureau (accessed 2026-10-14)
- Annual Business Survey 2020 (2021 ABS), Company Summary (AB2000CSCB01), bulk file, U.S. Census Bureau (accessed 2026-10-14)
- Annual Business Survey 2021 (2022 ABS), Company Summary (AB2100CSCB01), bulk file, U.S. Census Bureau (accessed 2026-10-14)
- Annual Business Survey 2022 (2023 ABS), Company Summary (AB2200CSCB01), bulk file, U.S. Census Bureau (accessed 2026-10-14)
- Annual Business Survey 2023 (2024 ABS), Company Summary (AB2300CSCB01), bulk file, U.S. Census Bureau (accessed 2026-10-14)
- Census Bureau upcoming data releases (2024 Annual Business Survey on 12/3/2026), U.S. Census Bureau (accessed 2026-10-14)
- Franchise Disclosure Document, salon suite franchise (issued May 1, 2025), Minnesota CARDS 33938-202504-08, Minnesota Department of Commerce (CARDS) (accessed 2026-10-14)
- Franchise Disclosure Document, salon suite franchise (issued May 5, 2026), Minnesota CARDS 36728-202605-10, Minnesota Department of Commerce (CARDS) (accessed 2026-10-14)
- Franchise Disclosure Document, salon suite franchise (issued September 19, 2025), Minnesota CARDS 34803-202509-12, Minnesota Department of Commerce (CARDS) (accessed 2026-10-14)
- Information Notice 5000-866746: Issuance of SOP 50 10 8, U.S. Small Business Administration (accessed 2026-10-14)
- Minnesota CARDS franchise registrations search, Minnesota Department of Commerce (accessed 2026-10-14)
- Nonemployer Statistics 2017, U.S. file (nonemp17us), U.S. Census Bureau (accessed 2026-10-14)
- Nonemployer Statistics 2024, U.S. file (nonemp24us), U.S. Census Bureau (accessed 2026-10-14)
- Nonemployer Statistics datasets page (2024 release dated September 29, 2026), U.S. Census Bureau (accessed 2026-10-14)
- Quarterly Census of Employment and Wages, annual averages by industry (812111 to 812199), 2017, 2019 and 2025, U.S. Bureau of Labor Statistics (accessed 2026-10-14)
- SBA 7(a) and 504 FOIA loan data (files as of 2026-06-30), U.S. Small Business Administration (accessed 2026-10-14)
- SBA Franchise Directory (document page), U.S. Small Business Administration (accessed 2026-10-14)
- SOP 50 10: Lender and Development Company Loan Programs (version history), U.S. Small Business Administration (accessed 2026-10-14)
- Staudt and Wei, Automating Response Evaluation for Franchising Questions on the 2017 Economic Census (CES-WP-19-20), U.S. Census Bureau, Center for Economic Studies (accessed 2026-10-14)
Tier 2: trade bodies, market research, company filings (6)
- FDD Item 12 dataset (data/fdd_item12.csv), Franchise Consultants and Brokers (accessed 2026-10-14)
- FDD Item 15 dataset (data/fdd_item15.csv), Franchise Consultants and Brokers (accessed 2026-10-14)
- FDD Item 19 dataset (data/item19_fields.csv), Franchise Consultants and Brokers (accessed 2026-10-14)
- FDD Item 20 dataset (data/item20_counts.csv), Franchise Consultants and Brokers (accessed 2026-10-14)
- FDD Item 7 dataset (data/fdd_item7.csv), Franchise Consultants and Brokers (accessed 2026-10-14)
- FDD fee dataset, 259 Minnesota FDDs (data/fdd_fees.csv), Franchise Consultants and Brokers (accessed 2026-10-14)
Related research
Home Service Franchise Statistics
3.2% of establishments in 22 home service industries were franchised (US, 2017)
Read the research
How Do Franchisors Make Money? Royalties, Fees and Units in 26 Public 10-Ks
23.5% median share of total revenue from the royalty line, 26 US-listed franchisors, latest fiscal year
Read the research
Real Estate Franchise Statistics
17.7% of U.S. real estate brokerage offices were franchised in 2017 (21,529 of 121,906)
Read the research
Shipping Store Franchise Statistics
67.5% of U.S. private mail centers (NAICS 561431) were franchises in 2017, the latest Census count
Read the researchHow to cite and reuse
Franchise Consultants and Brokers Editorial Team. "Beauty Salon Franchise Statistics: Salons, Barbers, Nails, Spas and Weight Loss." Franchise Consultants and Brokers, updated October 14, 2026. https://franchiseconsultantsandbrokers.com/research/beauty-salon-franchise-statistics/
The data tables and charts on this page are licensed under CC BY 4.0. Please credit “Franchise Consultants and Brokers, franchiseconsultantsandbrokers.com” with a link to this page.
Download the data
- Personal care franchise index, Census 2017 and SBA FY2020 to FY2026 (CSV)
- Franchise share by industry, 2007, 2012, 2017 (CSV)
- Employment and nonemployer context (CSV)
- SBA personal care loans by fiscal year (CSV)
- FDD terms by sector (CSV)
- Item 15 owner participation rules (CSV)
- Full fact sheet with sources (CSV)
- Full fact sheet with sources (CSV)